


Raman-Techniken:Grundlagen und Grenzen
Zusammenfassung
Angetrieben von Anwendungen in der chemischen Sensorik, der biologischen Bildgebung und der Materialcharakterisierung ziehen Raman-Spektroskopien zunehmendes Interesse in einer Vielzahl wissenschaftlicher Disziplinen auf sich. Der Raman-Effekt stammt aus der inelastischen Streuung von Licht und kann Vibrations-/Rotationsvibrationszustände in Molekülen und Materialien direkt untersuchen. Trotz zahlreicher Vorteile gegenüber der Infrarotspektroskopie ist die spontane Raman-Streuung sehr schwach, und folglich sind eine Vielzahl von verbesserten Raman-Spektroskopietechniken entstanden. Diese Techniken umfassen stimulierte Raman-Streuung und kohärente Anti-Stokes-Raman-Streuung sowie oberflächen- und spitzenverstärkte Raman-Streuungsspektroskopie. Der vorliegende Aufsatz vermittelt dem Leser ein Verständnis der grundlegenden physikalischen Grundlagen des Raman-Effekts und seiner Vorteile, Einschränkungen und Anwendungen. Der Aufsatz hebt auch die wichtigsten experimentellen Überlegungen zur Implementierung der wichtigsten experimentellen Raman-Spektroskopietechniken hervor. Abschließend werden die relevanten Datenanalysemethoden und einige der jüngsten Fortschritte im Zusammenhang mit dem Raman-Effekt vorgestellt. Dieser Aufsatz ist eine praktische Einführung in die Wissenschaft der Raman-Spektroskopie; es zeigt auch aktuelle und vielversprechende Richtungen zukünftiger Forschungsentwicklungen auf.
Einführung
Raman-Spektroskopie
Es gibt zahlreiche Formen der Licht-Materie-Wechselwirkung:Fluoreszenz und Phosphoreszenz sind Beispiele für die Absorption und anschließende Emission von Licht durch Materie. Elastische Lichtstreuung, wie Rayleigh-Streuung durch Atome, Moleküle oder Phononen, und Mie/Tyndall-Streuung durch Staubpartikel sind Beispiele, bei denen die Wellenlänge des Lichts unverändert ist. Inelastische Streuung wie Brillouin-Streuung durch akustische Wellen in Kristallen, Compton-Streuung durch geladene Teilchen und Raman-Streuung durch Moleküle oder Phononen sind Beispiele, bei denen sich die Wellenlänge des Lichts ändert [1]. Die Raman-Lichtstreuung an Molekülen wurde erstmals 1923 von Smekal mit Hilfe der klassischen Quantentheorie [2] vorhergesagt und 1928 von Raman und Krishnan experimentell beobachtet [3, 4].
Es gibt mittlerweile mehr als 25 verschiedene Arten bekannter Raman-Spektroskopietechniken, wie z. B. spontanes Raman, Hyper-Raman-Streuung, Fourier-Transform-Raman-Streuung [5], Raman-induzierte Kerr-Effekt-Spektroskopie [6] und stimulierte/kohärente Raman-Streuung [1] . Dieser Aufsatz betrachtet spontane und stimulierte Raman-Streuung, kohärente Anti-Stokes-Raman-Streuung (CARS), oberflächenverstärkte Raman-Streuung (SERS) und spitzenverstärkte Raman-Streuung (TERS).
Fünfzig Jahre nach ihrer ersten Beobachtung entwickelte sich die Raman-Spektroskopie zu einer herausragenden Analysetechnik neben anderen optischen Messtechniken, wie beispielsweise denjenigen, die die Absorption von Infrarotlicht beinhalten; insbesondere wenn Wasser und andere nützliche polare Lösungsmittel vorhanden waren, da diese Medien typischerweise Licht im Infrarotbereich stark absorbieren. 1974 haben Fleischmann et al. [7] verwendeten Raman-Spektroskopie, um zwei Arten von adsorbiertem Pyridin (ein basisches cyclisches Heterodyn-Verbindungsmolekül) auf der Oberfläche einer Silberelektrode zu unterscheiden, um Absorptionseffekte abzuschwächen. Dieses Experiment war übrigens die erste zufällige Beobachtung von SERS.
Die Raman-Spektroskopie ist heute eine herausragende Technik zur Charakterisierung von 2D-Materialien (z. B. . Graphen [8,9,10] und Übergangsmetalldichalkogenide [11,12,13]) und Phononenmoden in Kristallen [14,15,16]. Eigenschaften wie Anzahl der Monoschichten [9, 12, 17, 18], Atmungs- und Schermoden zwischen den Schichten [19], Anisotropie in der Ebene [20], Dotierung [21, 22, 23], Unordnung [10, 24, 25,26], Wärmeleitfähigkeit [11], Dehnung [27] und Phononenmoden [14, 16, 28] können mit Raman-Spektroskopie extrahiert werden.
Die biologischen und medizinischen Forschungsgebiete werden von der Entwicklung der Raman-Spektroskopie stark beeinflusst, da es sich um ein markierungsfreies (erfordert keine fluoreszierenden Markermoleküle [29, 30]) handelt, das chemisch selektive hyperspektrale Bildgebungsverfahren ist [31]. Zum Beispiel erfordert die Untersuchung der transdermalen Abgabe von Arzneimitteln in die Haut oft ex vivo und invasive Analysetechniken. Ex-vivo-Studien zur transdermalen Verabreichung sind ungünstig, da die Hautregeneration aufhört, die Immunantwort aufhört und die Stoffwechselaktivität normalerweise verloren geht. Daher spiegelt die Leistung der transdermalen Arzneimittelabgabe ex vivo nicht die in vivo-Situation wider [32]. Mit der Raman-Spektroskopie können jedoch nicht-invasive In-vivo-Messungen durchgeführt werden, um detaillierte Informationen über die molekulare Zusammensetzung und Konzentrationsgradienten in der Haut zu erhalten [33]. In vielen biologischen Prozessen wirken lebende Mikroorganismen wie Bakterien als Biokatalysatoren. Die Raman-Spektroskopie kann Inhomogenitäten der Eigenschaften und des physiologischen Status einzelner Zellen in biokatalytischen Prozessen untersuchen [34]. Die Raman-Spektroskopie wurde auch verwendet, um gutartige und bösartige Brustkrebsläsionen zu identifizieren und zu unterscheiden, indem ihre einzigartige chemische Zusammensetzung untersucht wurde [35].
Bei biologischen Proben finden sich etwa 90 % der Peaks im „Fingerabdruck“-Spektralbereich, der (\( \Updelta \overset{\sim }{\nu} \) ~ 500 cm −1 . abdeckt bis ~ 1800 cm −1 ; \( \Delta \overset{\sim }{\nu } \) ist die im Abschnitt „Analysemethoden“ definierte Wellenzahlverschiebung, wobei die verbleibenden in den höherenergetischen CH/OH-Streckschwingungsmoden (\( \Delta \overset{\sim }{\nu } \) ~ 2700 cm −1 bis ~ 3300 cm −1 ) [36].
Kohärente Raman-Spektroskopie
Kohärente Lichtstreuungsereignisse, bei denen mehrere einfallende Photonen gleichzeitig mit dem streuenden Material wechselwirkten, wurden erst in den 1960er Jahren beobachtet, als Laserquellen verfügbar wurden, obwohl bereits in den 1930er Jahren Vorhersagen gemacht wurden [37, 38]. Das erste laserbasierte Raman-Streuungsexperiment wurde 1961 demonstriert [39]. Stimulierte Raman-Streuung (SRS) und CARS sind zu prominenten Vier-Wellen-Mischtechniken geworden und in dieser Übersicht von Interesse.
SRS ist ein kohärenter Prozess, der im Vergleich zur spontanen Raman-Spektroskopie viel stärkere Signale sowie die Fähigkeit zur Zeitauflösung der Schwingungsbewegungen liefert. SRS ist relevant für zahlreiche Forschungsgebiete wie Plasmaphysik [40], Atominterferometrie [41], Superkontinuumserzeugung [42], Bildgebung von Biomolekülen in Lebensmittelprodukten [43], Bildgebungschemie in lebenden Zellen [44], Bulk-Medien und nanoskalige Proben [45]. Der Austausch des Bahndrehimpulses von Photonen durch SRS im Plasma gewinnt insbesondere im Rahmen der Trägheitsfusionsforschung an Interesse [40, 46, 47, 48]. Die Superkontinuumserzeugung ist ein komplexes nichtlineares Phänomen, das durch die dramatische spektrale Verbreiterung intensiver Lichtpulse gekennzeichnet ist, die durch ein nichtlineares Material gehen [49]. Ritteret al. [42] demonstrierten flache Ultrabreitband-Oktaven-überspannende Weißlicht-Superkontinuum-Erzeugung durch SRS und parametrisches Vier-Wellen-Mischen mit 60-ps-Pumppulsen von Sub-Kilowatt-Spitzenleistung in einer photonischen Kristallfaser. Kasevich und Chu [41] demonstrierten ein Materiewellen-Interferometer mit lasergekühlten Natriumatomen unter Ausnutzung der mechanischen Effekte stimulierter Raman-Übergänge. SRS wurde sogar verwendet, um zeitaufgelöste Schwingungsspektren der primären Isomerisierung von Retinal im Sehpigment Rhodopsin zu beobachten [50].
Seit seinem Wiederaufleben im Jahr 1999 hat sich CARS zu einem bedeutenden Bildgebungswerkzeug im Schwingungsmodus in der biologischen Medizin entwickelt [51, 52]. Da Anti-Stokes-Photonen gegenüber den Pump- und Stokes-Frequenzen blauverschoben sind, können sie in Gegenwart von Einzelphotonen-Fluoreszenz leichter nachgewiesen werden [53]. Die CARS-Mikroskopie wurde erfolgreich auf die Bildgebung lebender Zellen [51, 54], Skelettstammzellen [55], Aufspüren toxischer Nanomaterialien in biologischem Gewebe [56], volumetrische Bildgebung der menschlichen somatischen Zellteilung [57], Durchflusszytometrie [58, 59], Erkennung von Hirntumoren [60] und Verfolgung des Organellentransports in lebenden Zellen [61]. Ziraket al. [62] hat ein CARS-Endoskop für die In-vivo-Bildgebung entwickelt und das Instrument mit murinen Fettgewebe- und menschlichen Nerven-Suralis-Proben demonstriert. Evanset al. [63] haben CARS mit Videoratenmikroskopie kombiniert, um Gewebe in vivo chemisch abzubilden. Potma und Xie [64] haben die Lipidphasensegregation in einzelnen Lipiddoppelschichten mit CARS direkt visualisiert. CARS kann sogar als Thermografietechnik mit hoher zeitlicher und räumlicher Auflösung verwendet werden und hat Anwendungen in der Charakterisierung elektronischer und optoelektronischer Geräte [65] und sogar in Turbomaschinen [66] gefunden.
Die Orientierungsordnung ist ein hervorstechendes Merkmal vieler weicher Materiesysteme. Details in der strukturellen molekularen Organisation sind ein vorherrschendes Ziel auf dem Gebiet der Biologie, Biomedizin, Materialwissenschaften und Molekularphysik [67]. Polarisationsaufgelöste optische Mikroskopie wird zu einem leistungsstarken Werkzeug, um molekulare Orientierungsverteilungen im Fokusvolumen eines Mikroskops zu erfassen [68]. In der kohärenten nichtlinearen Optik wurden bereits die polarisierte Erzeugung der zweiten Harmonischen [69,70,71], die polarisierte Erzeugung der dritten Harmonischen [72] und die polarisierte Vierwellenmischung [73, 74] verwendet, um Orientierungsinformationen über endogene Proteine und Lipide in biologischen Gewebe. Zusätzlich zu den Orientierungsinformationen sind kohärente Raman-Streuung (CRS)-Prozesse empfindlich gegenüber molekularen Bindungsschwingungen, was eine chemische Spezifität ermöglicht, ohne dass Fluoreszenzmarkierungen/Farbstoffe erforderlich sind [75, 76, 77]. Die CARS-Mikroskopie kann verwendet werden, um die chemische und Orientierungsordnung von flüssigkristallinen (üblicherweise in der Displaytechnologie verwendeten) Proben abzubilden [78]. Auch die polarisationsaufgelöste hyperspektrale SRS-Mikroskopie wurde als markierungsfreies biomolekulares Bildgebungsverfahren an Zähnen demonstriert [79]. Darüber hinaus wurde polarisiertes CARS verwendet, um die molekulare Ordnung von Lipiden in Myelin auf Subbeugungsskalen bei Mäusen zu untersuchen [80].
Verbesserte Raman-Spektroskopie
Die Empfindlichkeit der Raman-Spektroskopie kann durch verschiedene Techniken wie die Resonanz-Raman-Spektroskopie [81], TERS [82, 83] oder SERS [84] gesteigert werden. SERS ist besonders interessant, da es eine Verstärkung des Raman-Signals um mehrere Größenordnungen ermöglicht, indem die Oberfläche modifiziert wird, auf der ein Analytmaterial platziert werden soll. Die verstärkte Licht-Materie-Wechselwirkung in TERS und SERS ist (bis zu einem gewissen Grad) durch Modifizieren der Oberflächennanostruktur von metallischen Filmen auf dielektrischen Oberflächen einstellbar [85, 86]. Die Wellenlänge von Ladungsdichteschwingungen, bekannt als Plasmonen, hängt von diesen Oberflächen-Nanostrukturen ab und kann die Licht-Materie-Wechselwirkung lokal verstärken [87]. Plasmonen sind ein prominentes Thema in der Physik und plasmonische Geräte wie Filter [88], Wellenleiter [88, 89], Polarisatoren [90] und nanoskalige Lichtquellen [91] wurden jetzt realisiert.
Fleischmannet al. [7] beobachteten erstmals SERS im Jahr 1974, als sie Pyridin auf der rauen Oberfläche einer Silberelektrode untersuchten [92]. Die Sensitivität von SERS macht es gut geeignet, Elektronentransferreaktionen zu untersuchen, die das Herzstück zahlreicher grundlegender Prozesse sind:Elektrokatalyse, Sonnenenergieumwandlung, Energiespeicherung in Batterien und biologische Ereignisse wie die Photosynthese [93]. SERS wurde auch als wertvolle Technik zum Nachweis von Sprengstoffen/chemischen Waffen [94], unmodifizierter DNA [95], Aerosolschadstoffen [96] und Krankheitserregern [97] identifiziert.
TERS ist eine Technik, die spektrale Informationen mit einer räumlichen Auflösung im Nanometerbereich liefert [98]. Seit den ersten Berichten über TERS im Jahr 2000 [99, 100] hat sich TERS zu einer leistungsfähigen Methode zur Untersuchung von dünnen kristallinen Materialien [101], Kohlenstoffnanoröhren[86, 102, 103], Einzelsträngen von RNA/DNA [104, 105 ], Redoxreaktionen [106], Kartierung einzelner Moleküle [83], Halbleiter-Nanostrukturen und Mikrokavitäten [107].
In den folgenden Abschnitten wird die grundlegende Physik, die dem spontanen Raman-Effekt zugrunde liegt, der stimulierten und kohärenten Raman-Spektroskopie, SERS und TERS im Kontext ihrer Anwendungen detailliert beschrieben. Experimentelle Überlegungen werden diskutiert und Beispiele für Raman-Spektroskopie-Instrumentenaufbauten werden vorgestellt. Für jede Anwendung der Raman-Spektroskopie werden die Konventionen zur Darstellung von Spektren detailliert beschrieben und Beispiele für Analysetechniken gegeben. In den letzten Abschnitten werden die jüngsten Fortschritte, die die aktuellen Grenzen der Raman-Spektroskopie ausmachen, aus verschiedenen Forschungsbereichen weltweit vorgestellt.
Grundprinzipien
Wenn Licht mit Materie interagiert, stört das oszillierende elektromagnetische (EM) Feld des Lichts die Ladungsverteilung in der Materie, was zu einem Energie- und Impulsaustausch führen kann, der die Materie in einem veränderten Zustand zurücklässt. Beispiele sind elektronische Anregungen und Molekularschwingungen oder Rotationsschwingungen (Ro-Vibrationen) in Flüssigkeiten und Gasen, elektronische Anregungen und optische Phononen in Festkörpern und Elektron-Plasma-Schwingungen in Plasmen [108].
Spontaner Raman
Wenn ein einfallendes Photon mit einem Kristallgitter oder Molekül wechselwirkt, kann es entweder elastisch oder unelastisch gestreut werden. Licht wird überwiegend elastisch gestreut (d.h.. die Energie des gestreuten Photons ist gleich der des einfallenden Photons). Diese Art der Streuung wird oft als Rayleigh-Streuung bezeichnet . Die unelastische Streuung von Licht durch Materie (d.h.. die Energie des gestreuten Photons ist nicht gleich der des einfallenden Photons) ist als Raman-Effekt bekannt [1, 4, 6]. Dieser unelastische Prozess belässt das Molekül in einem modifizierten (Ro-)Schwingungszustand. Im Fall eines Kristallgitters erzeugt die Energieübertragung ein Schwingungsquant im Gitter, das als Phonon bekannt ist (ein Quasiteilchen). Raman-Streuung in Kristallen kann auch zu paramagnetischen Ionen, Oberflächenplasmonen (die später in diesem Aufsatz diskutiert werden) und Spinwellen führen [15]. Die Verschiebung der Kreisfrequenz des Streulichts kann durch die folgende Gleichung beschrieben werden:
$$ {\omega}_{\mathrm{scat}}={\omega}_{\mathrm{p}}\pm {\omega}_{\mathrm{osc}}, $$ (1)wobei osc die Gitter- oder Molekülschwingung bezeichnet, p das einfallende Photon bezeichnet (oft als Pumpphoton bezeichnet ) und scat bezeichnet das Streulicht [1]. Der binäre Operator (±) wird durch die Energieerhaltung bestimmt. Wenn die Energie des gestreuten Photons niedriger ist als die des einfallenden Photons (d. h.. rotverschoben), wird der Prozess als Stokes-Raman-Streuung bezeichnet . Umgekehrt, wenn die Energie des gestreuten Photons höher ist als die des einfallenden Photons (d. h. . blau verschoben), wird der Prozess als Anti-Stokes-Raman-Streuung bezeichnet . Der Raman-Prozess muss auch den Impuls erhalten, der in Wellenvektorform ausgedrückt wird als:
$$ {\overset{\rightharpoonup }{k}}_{\mathrm{scat}}={\overset{\rightharpoonup }{k}}_{\mathrm{p}}\pm \overset{\rightharpoonup }{ q}, $$ (2)wobei \( {\overset{\rightharpoonup }{k}}_{\mathrm{scat}} \), \( {\overset{\rightharpoonup }{k}}_{\mathrm{p}} \) und \ ( \overset{\rightharpoonup }{q} \) sind die Wellenvektoren des Streulichts, des einfallenden Lichts und der Phononen bzw. molekularen (Ro-)Schwingungen.
In Molekülen und Kristallen hat die Ladungsverteilung einen Gleichgewichtszustand, zu dem sie tendiert. Ein von außen angelegtes Feld kann die Ladungsverteilung verändern oder stören, jedoch nur in Übereinstimmung mit der Fähigkeit des Moleküls oder Kristalls, Dipole zu bilden, die anisotrop sein können. Diese anisotrope Eigenschaft von Molekülen und Kristallen wird Polarisierbarkeit bzw. dielektrische Suszeptibilität genannt. Der klassische Ansatz theoretisiert, dass die Existenz des Raman-Effekts aufgrund der oszillatorischen Natur ihrer interatomaren Verschiebung mit der Modulation der Polarisierbarkeit (für molekulare (Ro-)Schwingungen) oder dielektrischen Suszeptibilität (für Kristallgitterschwingungen) verbunden ist [6, 109 ]. Betrachten Sie für Kristallgitterschwingungen den Polarisationsvektor des Materials \(\overset{\rightharpoonup}{P}\). Wenn die Suffixe j und k repräsentieren die Vektorkomponenten im x , y und z Richtungen, die j te Komponente von \( \overset{\rightharpoonup }{P} \) (zu erster Ordnung ) hängt mit dem oszillatorischen elektrischen Feldvektor \( \overset{\rightharpoonup }{E} \) zusammen, der dem Licht durch [110] zugeordnet ist:
$$ {P}_j^{(1)}={\varepsilon}_0{\chi}_{jk}^{(1)}{E}_k, $$ (3)wo ε 0 ist die Permittivität des freien Raums, χ jk ist die dielektrische Suszeptibilität des Materials (ein Rang-2-Tensor) und die Konvention der Summation über wiederholte Indizes ist impliziert [109]; das hochgestellte (1) bedeutet, dass dies der Beitrag erster Ordnung zur Polarisation ist [1]. Der Polarisierbarkeitstensor ist eine Funktion der Kernkoordinaten, was bedeutet, dass er auch von der (Ro-)Schwingungsfrequenz abhängt. Unter der Annahme, dass die Modulation klein ist, kann die Abhängigkeit in Bezug auf die Schwingungskoordinaten in einer Taylor-Reihe wie folgt ausgedrückt werden:
$$ {\chi}_{jk}^{(1)}\left({\overset{\rightharpoonup }{k}}_{\mathrm{p}},{\omega}_{\mathrm{p} }\right)\approx {\chi}_{jk}^{(1)}{\left({\overset{\rightharpoonup }{k}}_{\mathrm{p}},{\omega}_{ \mathrm{p}}\right)}_{\overset{\rightharpoonup }{u}=0}+{u}_l{\left(\frac{\partial {\chi}_{jk}^{(1 )}\left({\overset{\rightharpoonup }{k}}_{\mathrm{p}},{\omega}_{\mathrm{p}}\right)}{\partial {u}_l}\ rechts)}_{\overset{\rightharpoonup }{u}=0}+{u}_l{u}_m{\left(\frac{\partial^2{\chi}_{jk}^{(1) }\left({\overset{\rightharpoonup }{k}}_{\mathrm{p}},{\omega}_{\mathrm{p}}\right)}{\partial {u}_l\partial { u}_m}\right)}_{\overset{\rightharpoonup }{u}=0}+\dots, $$ (4)wobei \( \overset{\rightharpoonup }{u} \) der Kernverschiebungsvektor ist, die Indizes j , k , l und m geben verschiedene räumliche Koordinaten mit wiederholten Indizes in einem der Begriffe an, die die Summation der Bestandteile dieses Index implizieren. Wenn wir das mit dem Licht verbundene elektrische Feld wie folgt schreiben:
$$ \overset{\rightharpoonup }{E}\left(\overset{\rightharpoonup }{r},t\right)=\overset{\rightharpoonup }{E}\left({\overset{\rightharpoonup }{k }}_{\mathrm{p}},{\omega}_{\mathrm{p}}\right)\cos \left({\overset{\rightharpoonup }{k}}_{\mathrm{p}} \bullet \overset{\rightharpoonup }{r}-{\omega}_{\mathrm{p}}t\right), $$ (5)und die nukleare Verdrängung wie folgt:
$$ \overset{\rightharpoonup }{u}\left(\overset{\rightharpoonup }{r},t\right)=\overset{\rightharpoonup }{u}\left(\overset{\rightharpoonup }{q} ,{\omega}_{\mathrm{osc}}\right)\cos \left(\overset{\rightharpoonup }{q}\bullet \overset{\rightharpoonup }{r}-{\omega}_{\mathrm {osc}}t\right), $$ (6)ein expliziter Ausdruck für die Zeitabhängigkeit von \({P}_j^{(1)}\) kann durch Substitution dieser beiden mathematischen Gleichungen des monochromatischen Lichts und der Verschiebung gefunden werden. Die zahlreichen resultierenden Begriffe beziehen sich auf optische Prozesse wie Rayleigh-Streuung, optische Absorption und Raman-Streuung. Der Term, der zur Raman-Streuung erster Ordnung gehört, leitet sich aus dem zweiten Term auf der rechten Seite von Gl. 4 und ergibt:
$$ {P}_j\left(\overset{\rightharpoonup }{r},t,\overset{\rightharpoonup }{u}\right)=\frac{1}{2}{\varepsilon}_0{\left (\frac{\partial{\chi}_{jk}^{(1)}\left({\overset{\rightharpoonup }{k}}_{\mathrm{p}},{\omega}_{\ mathrm{p}}\right)}{\partial{u}_l}\right)}_{\overset{\rightharpoonup }{u}=0}{u}_l\left(\overset{\rightharpoonup }{q },{\omega}_{\textrm{osc}}\right){E}_k\left({\overset{\rightharpoonup }{k}}_{\textrm{p}},{\omega}_{ \mathrm{p}}\right)\times \left\{\cos \left[\left({\overset{\rightharpoonup }{k}}_{\mathrm{p}}+\overset{\rightharpoonup }{ q}\right)\bullet \overset{\rightharpoonup }{r}-\left({\omega}_{\mathrm{p}}+{\omega}_{\mathrm{osc}}\right)t\ rechts]\bullet +\cos \left[\left({\overset{\rightharpoonup }{k}}_{\mathrm{p}}-\overset{\rightharpoonup }{q}\right)\bullet \overset{ \rightharpoonup }{r}-\left({\omega}_{\mathrm{p}}-{\omega}_{\mathrm{osc}}\right)t\right]\right\} $$ (7 )Dieser Term enthält Summen- (Anti-Stokes) und Differenzfrequenzen (Stokes) und zeigt die Impulserhaltung nach Gl. 1 und 2. Diese Formulierung folgt der klassischen Beschreibung aus Lit. [1, 109].
Die quantenmechanische Beschreibung des Raman-Prozesses besagt, dass die (Ro-)Schwingungsenergie der Moleküle/Phononen diskrete Quanten sind. Abbildung 1a zeigt ein Energieniveaudiagramm, das die Raman-Prozesse mit Stokes-Emission bei ω . veranschaulicht S und Anti-Stokes-Emission bei ω AS .
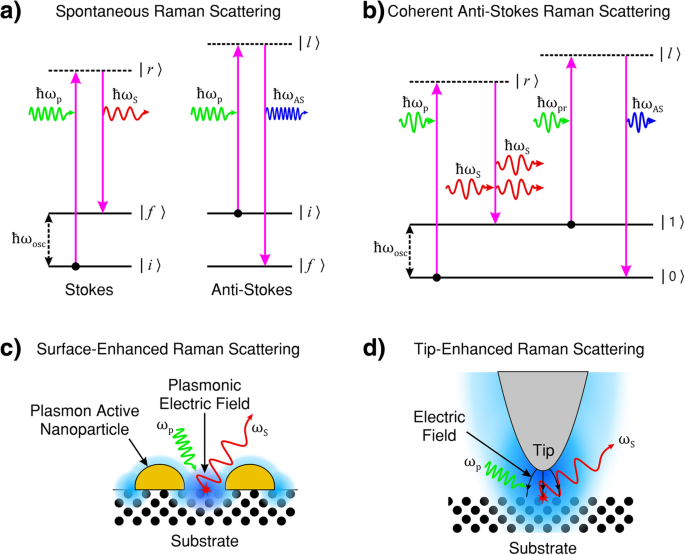
a Energieübertragungsprozess bei Stokes (links) und Anti-Stokes (rechts) Raman-Streuung, bei beiden Streuprozessen ist die Lebensdauer des angeregten Zustands probabilistisch und spontan. Bei der Stokes-Raman-Streuung ist die anfängliche (Ro-)Schwingungsenergie |i〉 des streuenden Materials kleiner als der Endzustand |f〉 , das Streulicht hat weniger Energie als das Pumplicht. Bei der Anti-Stokes-Streuung ist die anfängliche (Ro-)Schwingungsenergie |i〉 des Streumediums ist größer als der des Endzustandes |f〉 , hat das Streulicht mehr Energie als das Pumplicht. b Kohärente Anti-Stokes-Raman-Streuung (CARS). CARS ist ein Vier-Wellen-Mischprozess von Pump-, Stokes-, Probe- und Anti-Stokes-Licht, bei dem die Emission von Anti-Stokes-Licht kohärent durch eine intermediäre (Ro-)Schwingungs-Energiezustands-Populationsumkehr induziert wird. c Oberflächenverstärkte Raman-Streuung (SERS). Das einfallende Pumplicht induziert eine Oberflächenplasmonenresonanz. Die daraus resultierende Verstärkung der oszillatorischen elektromagnetischen (EM) Feldstärke (blau dargestellt) auf der Oberfläche verstärkt die Licht-Materie-Wechselwirkung und erhöht folglich die Intensität des Raman-Streulichts. d Tip-verstärkte Raman-Streuung (TERS). Das einfallende Pumplicht induziert eine Spitzenoberflächen-Plasmonenresonanz, die mit der plasmonisch aktiven Spitze verbunden ist. Die resultierende Verstärkung der oszillatorischen EM-Feldstärke (blau dargestellt) ist in der Nähe des Spitzenapex lokalisiert. Der Leuchtstabeffekt (dargestellt durch gekrümmte schwarze Pfeile) intensiviert die Licht-Materie-Wechselwirkung im Spitzenbereich und ermöglicht eine hochauflösende (über die Beugungsgrenze des Lichts hinausgehende) Raman-Bildgebung. a , b angepasst aus [1]. c adaptiert aus [111]. d angepasst von [112]
Bei der Raman-Streuung werden die Zwischenzustände der Störung durch das einfallende Pumpphoton (| r 〉 und | l 〉 in Abb. 1a, b) entsprechen im Allgemeinen keinen elektronischen Zuständen des Systems und werden als virtuelle Energiezustände bezeichnet. Diese virtuellen Zwischenzustände repräsentieren keinen wohldefinierten Energiezustand des Systems. Wenn sich die Frequenz des Pumpphotons der Energie der elektronischen Zustände annähert, nimmt die Stärke des Raman-Effekts aufgrund von Resonanzeffekten zu und wird als Präresonanz-Raman bezeichnet. Wenn der Zwischenzustand einem diskreten elektronischen Energiezustand entspricht, wird die Wechselwirkung als Resonanz-Raman-Streuung beschrieben, und es wird erwartet, dass die Signalstärke die der virtuellen Zwischenzustand-Raman-Streuung um Größenordnungen übertrifft. Liegt die Energie des einfallenden Lichts im Bereich dissoziativer Energieniveaus, wird der Vorgang als Kontinuumsresonanz-Raman-Streuung beschrieben [1].
Raman-Streuungsübergänge zwischen bestimmten Quantenzuständen sind verboten. In Materialien mit Inversionssymmetrie (d. h.. zentrosymmetrische Kristallstruktur [113]), müssen Anfangs- und Endzustand die gleiche Parität aufweisen und schließen sich bei absorbierenden Übergängen (optisch aktiven Übergängen) gegenseitig aus. Mit anderen Worten, Übergänge können entweder Raman-aktiv oder optisch aktiv sein. Bei linearen Molekülen sind die symmetrischen Streckschwingungen oder Biegungen Raman-aktiv und optisch inaktiv; diejenigen mit antisymmetrischen Moden sind Raman-inaktiv und optisch aktiv (d. h. . sich gegenseitig ausschließen) [1]. Diese Regel ist allgemein und für nichtlineare Moleküle wird der gegenseitige Ausschluss gelockert. In Materialien ohne Inversionssymmetrie kann der (Ro-)Schwingungsmodusübergang sowohl Raman als auch optisch aktiv sein [1, 108].
Das Stokes-Raman-Signal für Moleküle ist intensiver als das Anti-Stokes-Signal, da die Population der Energiezustände von der thermischen Statistik bestimmt wird [1, 108]. Bei bosonischen Systemen, wie Phononen in Kristallen, gehorcht die Wahrscheinlichkeit, dass das Streuziel einen gegebenen Schwingungsquantenenergiezustand einnimmt, der Bose-Einstein-Statistik. Bei nichtresonanter Raman-Streuung und thermischem Gleichgewicht ist das Verhältnis der Anti-Stokes- und Stokes-Streuintensität gegeben durch [109]:
$$ \frac{I_{\textrm{AS}}}{I_{\textrm{S}}}={\left(\frac{\omega_{\textrm{p}}+{\omega}_{\textrm {osc}}}{\omega_{\mathrm{p}}-{\omega}_{\mathrm{osc}}}\right)}^4{e}^{\left(-\frac{\mathrm{ \hslash}{\omega}_{\mathrm{osc}}}{kT}\right)} $$ (8)wo ich S und ich AS sind die Intensität des Stokes- bzw. Anti-Stokes-Lichts, ℏ ist die Plancksche Konstante geteilt durch 2π , k ist die Boltzmann-Konstante und T ist die Temperatur, die mit der streuenden Spezies verbunden ist. Diese Gleichung wird manchmal verwendet, um die Temperatur mittels Raman-Spektroskopie zu messen [65]. Diese Beziehung wird für die Resonanz-Raman-Streuung ungenau, da die Stokes- und Anti-Stokes-Prozesse bei unterschiedlichen Pumpphotonenfrequenzen auftreten [109].
Bei spontaner Raman-Streuung ist der Raman-Effekt sehr schwach; normalerweise 1 von 10 8 der einfallenden Strahlung unterliegt einer spontanen Raman-Streuung [6]. Der Übergang vom virtuell angeregten Zustand in den Endzustand kann zu jedem Zeitpunkt und nach Wahrscheinlichkeit in jeden möglichen Endzustand erfolgen. Daher ist die spontane Raman-Streuung ein inkohärenter Prozess. Die Ausgangssignalleistung ist proportional zur Eingangsleistung, in zufällige Richtungen gestreut und abhängig von der Polarisationsrichtung. Beispielsweise ist in einem System gasförmiger Moleküle die molekulare Orientierung relativ zum einfallenden Licht zufällig und daher ist ihr Polarisationswellenvektor ebenfalls zufällig. Da der angeregte Zustand außerdem eine endliche Lebensdauer hat, gibt es eine damit verbundene Unsicherheit in der Übergangsenergie, die zu einer natürlichen Linienverbreiterung der Wellenlänge nach dem Heisenbergschen Unschärfeprinzip (∆E∆t ℏ /2) [1]. Das Streulicht hat im Allgemeinen andere Polarisationseigenschaften als die einfallende Strahlung. Außerdem sind Intensität und Polarisation abhängig von der Richtung, aus der das Licht gemessen wird [1]. Das Streuspektrum weist Spitzen bei allen aktiven Raman-Moden auf; die relative Stärke der spektralen Peaks wird durch den Streuquerschnitt jeder Raman-Mode bestimmt [108]. Photonen können aufeinanderfolgende Rayleigh-Streuungsereignisse durchlaufen, bevor Raman-Streuung auftritt, da Raman-Streuung weit weniger wahrscheinlich ist als Rayleigh-Streuung.
Nichtlineare Anfälligkeit
Die durch Gl. 3 stimmt mit erster Ordnung überein (d.h.. lineare) Optik und beschreibt das Einzelphotonen-Streuverfahren (Zwei-Wellen-Mischverfahren). Bei Wellenmischprozessen mit mehr als zwei Wellen muss aufgrund der Produkte der gemischten elektrischen Feldkomponenten eine nichtlineare optische Polarisation berücksichtigt werden. Die nichtlineare optische Polarisation kann durch [110] wie folgt beschrieben werden:
$$ {P}_j={\varepsilon}_0\left[{\chi}_{jk}^{(1)}{E}_k+{\chi}_{jk l}^{(2)}{E }_k{E}_l+{\chi}_{jk lm}^{(3)}{E}_k{E}_l{E}_m+\dots\right], $$ (9)wo χ (2) ist die Suszeptibilität zweiter Ordnung (Tensor Rang drei), χ (3) ist die Suszeptibilität dritter Ordnung (Tensor des vierten Ranges) und die Summe über wiederholte Indexindizes ist wiederum impliziert. Jeder der Terme in Gl. 9 kann in Kürze geschrieben werden durch \( {\overset{\rightharpoonup }{P}}^{(1)} \), \( {\overset{\rightharpoonup }{P}}^{(2)} \) , \( {\overset{\rightharpoonup }{P}}^{(3)} \), usw. Die physikalischen Prozesse, die aufgrund der Polarisation zweiter Ordnung auftreten, \( {\overset{\rightharpoonup }{P} }^{(2)} \), unterscheiden sich tendenziell von denen, die sich aus der Polarisation dritter Ordnung ergeben, \( {\overset{\rightharpoonup }{P}}^{(3)} \). Diese Polarisation kann elektrische Dipol-, Quadrupolar-, Oktupolar-(usw.)-Beiträge haben. Unter der Näherung des elektrischen Dipols kann die Polarisation zweiter Ordnung nur in Kristallen auftreten, die nicht zentrosymmetrisch sind (fehlende Inversionssymmetrie). Daher χ (2) verschwindet für Medien wie Flüssigkeiten (z.B.. Flüssigkeit/Gas) und amorphe Feststoffe (z.B.. Glas). Nichtlineare optische Wechselwirkungen dritter Ordnung (d. h.. die von einem χ . beschriebenen (3) Suszeptibilität) kann sowohl für zentrosymmetrische als auch für nicht zentrosymmetrische Systeme auftreten [109, 110]. Elektrischer Quadrupolarer, Oktupolarer, (usw.) χ (2) Beiträge verschwinden nicht unter Inversionssymmetrie.
Stimulierte Raman-Streuung
Während die spontane Raman-Streuung ein inkohärenter Prozess ist, ist SRS ein kohärenter nichtlinearer optischer Vierwellen-Mischprozess. Die Schwingungsmoden sind in Phase und bilden eine kohärente Modulation der Polarisation in der Probe mit Anfälligkeit χ (3) (ω S; ω p + ω S − ω p ) [110]. Auch das Streulicht ist kohärent [45]. Der SRS-Prozess ist abhängig vom spontanen Raman-Querschnitt, der spektralen Linienbreite, der Weglänge der Licht-Feld-Materie-Wechselwirkung, der Eingangsintensität und der optischen Rückkopplung (Lichterzeugung) von Stokes-Frequenzlicht [110].
Wenn Photonen der Frequenz ω p und ω S gleichzeitig mit einem Molekül oder Kristallgitter im Grundzustand wechselwirken, schwingt das System mit einer induzierten Frequenz:ω osc = ω p − ω S . Im Gegensatz zur spontanen Raman-Streuung werden die Abregungszeit (Entspannungszeit) und die Energie des Endzustands durch den Stimulationseffekt bestimmt. Die Wechselwirkung führt zum Energietransfer vom Pumpphoton auf das Molekül/Gitter, und das Molekül/der Kristall streut ein neues Photon mit Frequenz und Phase, die der des einfallenden Lichts der Frequenz ω . entsprechen S . Abbildung 2a zeigt den Prozess schematisch.
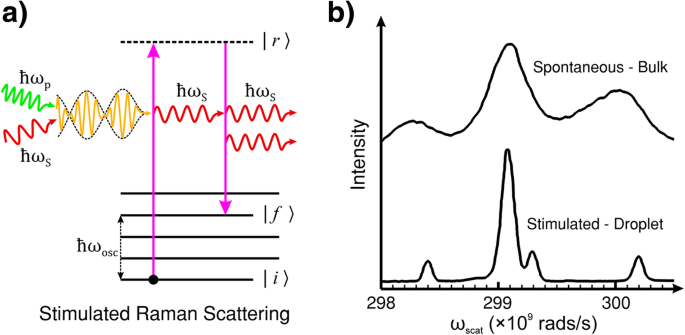
a Energieniveaudiagramm der stimulierten Raman-Streuung (SRS). SRS ist die induzierte Emission von Stokes-Licht durch die kohärente Wechselwirkung des Pump- und Stokes-Lichts mit dem Material. Im Gegensatz zur spontanen Raman-Streuung, bei der die Lebensdauer des Staates |r〉 and the energy of the final state |f〉 are probabilistic, in SRS, the (ro-)vibration of the molecule or lattice is coherently driven by the difference frequency of the pump and Stokes light. b Comparison of spontaneous Raman scattering and SRS of bulk and droplet ethanol. The spontaneous measurements were performed in a cuvette (bulk ethanol). The SRS measurements were performed in a droplet of ethanol which acted as an optical resonator for the Stokes light. b reproduced with permission from the OSA [114]
It is common to employ an external radiation source tuned to the Stokes frequency in tandem with the pump laser beam to provoke this effect. This technique can lead to exponential gain in the Stokes signal, by transferring energy from the pump radiation, and rapid population of the final (ro-)vibrational state |f 〉 [115]. However, if the intensity of the incident light of frequency ω p is sufficient, the generation of Stokes frequency photons within the material can self-promote SRS without the need for an external ω S Quelle. The intensity threshold of incident light in organic liquids, such as ethanol, for this kind of self-generated SRS typically requires an incident peak intensity of pump light> 10 9 W/cm 2 for an optical path length of a few centimetres. However, the SRS threshold can be significantly reduced by extending the length of the pump and Stokes field interaction with an optical resonator, such as internal reflection in a droplet of liquid. The example shown in Fig. 2b is the SRS spectrum taken with droplets of ethanol directly compared to the spontaneous Raman spectrum of bulk ethanol. The droplets act to confine the light by internal reflection which feeds back the Stokes light as a self-SRS inducing optical resonator [114].
Coherent Anti-Stokes Raman Scattering
CARS is a third-order nonlinear four-wave optical mixing process. Figure 1b shows the energy level diagram for the process. A pump beam and probe beam of frequency ω p und ω pr are mixed with a third beam of frequency ω S (Stokes frequency) and incident on the sample. The frequency difference (ω p − ω S ) needs to match the frequency associated with the Raman active (ro-) vibrational mode ω osc = ω p − ω S [4, 53, 56, 116]. The frequency of the Stokes beam is usually adjusted/tuned to satisfy this criterion [117]. Next, a probe photon of frequency ω pr provides a perturbation for the anti-Stokes scattering process to occur at frequency ω AS = ω p − ω S + ω pr [5]. A macroscopic third-order polarisation, P (3) , is induced due to the coherent superposition of the microscopic dipole oscillations [53]. Hence, CARS is governed by the third-order susceptibility of the form:χ (3) (ω AS ; ω p − ω S + ω pr ).
There are numerous treatments and approaches to formulating expressions for χ (3) . If one assumes that the excitation field is much weaker than the intramolecular forces, then a perturbative approach can be adopted [5, 110]. If this is not the case, non-perturbative treatments can be considered [118]. By considering the density matrix equation of the system and expressing the external field interaction as a perturbation in the Hamiltonian, the semi-classical nonlinear optics theory generates an expression for χ (3) with 48 terms, each of which contribute to the third-order susceptibility [5]. A generalised expression for dominant terms in resonant CARS is given by the following [51, 119]:
$$ {\chi}^{(3)}=\frac{A_R}{\omega_{osc}-\left({\omega}_p-{\omega}_S\right)-i{\Gamma}_R}+{\chi}_{NR}^{(3)}, $$ (10)where ΓR is the half width at half maximum for the Raman line [51]; A R is a constant representing the Raman scattering cross-section. The first term is the contribution due to CARS vibrational resonance as in Fig. 1b (ω osc = ω p − ω S ). The second term is the nonresonant background signal and is independent of the Raman shift (ω osc ≠ ω p − ω S ). The nonresonant background occurs because not all quantum pathways of the scattering process involve a resonance with a (ro-)vibrational state. This nonresonant contribution interferes with the resonant part of the signal. The nonresonant background causes distinctive distortions of CARS spectra in comparison with spontaneous Raman spectra and has prevented CARS from becoming a widespread technique [120].
The incident light beams of differing frequency move in and out of phase with each other in both time and space. Hence, the CARS signal reaches its first maximum when the field-sample interaction length scale is less than the coherence length scale to yield constructive interference [121, 122]. For plane-wave pump and Stokes beams, the intensity of the anti-Stokes signal is as follows [53, 123]:
$$ {I}_{\mathrm{AS}}\propto {\left|{\chi}^{(3)}\right|}^2{I}_{\mathrm{p}}{I}_{\mathrm{p}\mathrm{r}}{I}_{\mathrm{S}}{\left(\frac{\sin \left(\Delta \overset{\rightharpoonup }{k}\bullet \frac{\overset{\rightharpoonup }{z}}{2}\right)}{\frac{\left|\Delta \overset{\rightharpoonup }{k}\right|}{2}}\right)}^2, $$ (11)where \( \overset{\rightharpoonup }{z} \) is the sample thickness (vector normal to the lattice cell surface), \( \overset{\rightharpoonup }{k} \) is the wavevector of light, \( \Delta \overset{\rightharpoonup }{k}={\overset{\rightharpoonup }{k}}_{\mathrm{p}}-{\overset{\rightharpoonup }{k}}_{\mathrm{S}}+{\overset{\rightharpoonup }{k}}_{\mathrm{p}\mathrm{r}}-{\overset{\rightharpoonup }{k}}_{\mathrm{AS}} \) is the wavevector mismatch (the velocity difference between the four waves) and I ich is the intensity of the wave denoted by the subscript. Phase matching is achieved when \( \Delta \overset{\rightharpoonup }{k}=0 \) and the intensity of the anti-Stokes signal is maximised because the energy and momentum transfer processes correspond to allowed transitions. As the magnitude of χ (3) is linearly proportional to the number oscillators involved in the process, the intensity of the anti-Stokes signal is quadratically proportional to the number/concentration of oscillators [53].
Researchers typically employ the pump beam to provide the second virtual excitation (i.e. the probe light shown in Fig. 1b; i.e ωpr = ω p und ω AS = 2ω p − ω S ) [119]. The intensity of the CARS signal is therefore quadratically proportional to the intensity of the pump beam (see Eq. 11). The CARS signal is monodirectional due to the phase-matching condition [120]. However, high numerical aperture (NA) lenses or microscope objectives (confocal light) are commonly employed to satisfy the phase-matching condition without the need for complex mechanical systems to achieve phase-matched beam alignment [5, 117].
Raman resonances typically have coherence times of ~ 1 ps. Hence, the pump and Stokes beams are typically pulsed in picosecond timescales to obtain coherent excitation [124] and to inhibit multiphoton effects [53]. The CARS process takes place in the immediate vicinity of the beam’s focal spot. The signal produced is typically 10 6 times that of spontaneous Raman scattering. CARS microscopy offers non-invasive characterisation and imaging of (ro-)vibrational spectra with high sensitivity and spectral resolution as well as three dimensional sectioning capabilities [116].
Surface Plasmons and Polaritons
Surface plasmons can occur at the interface between a dielectric and conducting material, such as a metal or degenerate semi-conductor [88, 125]. They are the light-induced coherent oscillations of surface conduction electrons about their equilibrium position. The nanoscale volume of opposing charge that remains acts as a restoring force on the electrons. The result can be described with a damped simple harmonic oscillator model, in which the oscillations of the free-charge carriers have an associated resonance. Surface plasmons can be excited by EM radiation and plasmonics is the study of these light-matter interactions [126].
Plasmonic nanoparticles that are much smaller than the wavelength of the incident light can support non-propagating surface plasmons that oscillate with a frequency known as the local surface plasmon resonance (LSPR) [127, 128]. The wavelength of surface plasmons is much shorter than that of the associated propagating light for a given frequency [129]. The LSPR wavelength is dependent on the nanoparticle’s size, shape, material, external dielectric properties and inter-nanoparticle separation [85, 127, 128, 130,131,132,133].
Surface plasmons that propagate are referred to as surface plasmon polaritons (SPPs) [134,135,136]. They are essentially light waves that are trapped at the interface due to their interaction with the free electrons of the conducting material [88]. For a planar dielectric-conducting interface, polaritons propagate in 2-dimensional space along the surface interface for length scales of tens to hundreds of micrometres [126, 134,135,136]. They decay evanescently in the direction perpendicular to the surface interface with 1/e decay lengths of up to 200 nm [126, 137]. The field intensity in this evanescent decay region is amplified by orders of 10 to 100 relative to the incident radiation [136]. Hence, light-matter interactions with adsorbed molecules on the surface are also enhanced.
In the case of LSPR, the surface roughness or surface nanoparticles cause local concentrations of charge carriers which further amplify the evanescent EM field due to the lightning rod effect [138]. Even larger field-enhancements (up to 10 6 ) can be observed in gap plasmons (in the gap between two neighbouring plasmonic nanoparticles; see Fig. 1c) [85, 111]. This enhanced near-field effect gives rise to the technique known as SERS and is discussed in the next section.
Surface-Enhanced Raman Scattering
Raman is generally a very weak process; it is estimated that approximately one in every 10 8 photons undergo Raman scattering spontaneously [6]. This inherent weakness poses a limitation on the intensity of the obtainable Raman signal. Various methods can be used to increase the Raman throughput of an experiment, such as increasing the incident laser power and using microscope objectives to tightly focus the laser beam into small areas. However, this can have negative consequences such as sample photobleaching [139]. Placing the analyte on a rough metal surface can provide orders of magnitude enhancement of the measured Raman signal, i.e. SERS.
Two mechanisms have been proposed to explain the increase in Raman signal provided by SERS. The first is via EM enhancements where local surface plasmons concentrate the local electric field near the surface of the metal in ‘hot spots’ located on the sharp edges of nanostructures or in regions of concentrated free-charge carriers due to the lighting rod effect [140]. Figure 1c, illustrates the SERS process. This process can increase Raman generation by a factor of 10 8 to 10 11 [86, 141,142,143,144]. The second method is chemical enhancement via charge transfer between the metal surface and the analyte, which enhances Raman scattering by a factor of approximately 10 2 to 10 3 [86, 145,146,147]. However, the charge transfer mechanism only applies to specific molecules, whereas the EM mechanism is applicable for all analytes [4, 92, 102, 148].
The ubiquity of EM enhancements has led to the development of numerous SERS substrates, which can be divided into two groups:metallic nanostructures fabricated on a solid substrate [85] and colloidal suspensions of plasmonic nanoparticles [96, 141]. The most common materials used to fabricate SERS substrates are gold and silver because of their good plasmonic response [149]. Gold also benefits from chemical stability as it is a noble metal. Other metals are also being investigated, such as aluminium for UV Raman spectroscopy [150, 151].
Tip-Enhanced Raman Scattering
The diffraction limit of light restricts the focus spot size in standard optical techniques (such as Raman spectroscopy) to be at least half of the wavelength of the light according to Abbe’s criterion [152,153,154]. Light from the sample is composed of both propagating and non-propagating radiation. The non-propagating evanescent waves remain in the vicinity of their sources and do not participate in image formation in the far field. Instead, they extend laterally on the sample among the plasmon-active sites. Hence the spatial resolution is restricted by the size of the focal spot of the light. Even with a focal spot size of a half-wavelength (~ 250 nm for visible light), any objects that are much smaller than the half-wavelength would appear as a defuse shape.
TERS is a relatively new optical nanoimaging technique that combined Raman spectroscopy with scattering (or apertureless) scanning near-field optical microscopy. TERS offers spatial resolution far beyond the diffraction limit of the probing light. In the context of the a priori description, this is achieved by forcing the near-field evanescent light into the far-field image formation [86]. At the present date, the spatial resolution of TERS is typically reported to be 10–30 nm and is largely assumed to scale with the size of the tip’s apex [103, 155,156,157]. Incremental improvements to this resolution have been reported [104, 158]. Enhancement factors for TERS are significantly weaker than SERS due to the relative size of the probed signal volume. The enhancement factor (relative to spontaneous Raman scattering) is typically reported to be 10 3 to 10 6 . As with SERS, two field enhancement mechanisms are thought to contribute to the Raman signal:EM and chemical enhancement [86].
TERS is implemented by positioning a plasmon-active (plasmonic) nanotip approximately 50 nm above the sample’s region of interest. The Raman probe light is focused onto the tip-surface cavity to induce LSPR within the tip’ apex and (in some circumstances) the sample surface. The surface plasmons may then enhance evanescent or near-field light with the incident probe light and/or the Raman scattered light. Hence, the LSPRs both confine and enhance the light field in the vicinity of the tip’s apex. The enhanced local EM field is most concentrated at the tip apex due to the lightning rod effect. This evanescent light at the tip apex can then excite or stimulate Raman, two-photon or second harmonic scattering from a nanoscale volume of the sample under the tip. A Raman image of the sample surface can be obtained by raster scanning the sample under the nanometric tip.
Experimental Considerations
Instrumentation
The nonresonant Raman effect is a very weak process. Hence, monochromatic, narrow-beam and high-intensity lasers are preferable to produce quality Raman spectra. The exploitation of microelectronics, such as stepper motor drives, photon counters, digital data acquisition and computational processing systems can further enhance the quality of spectra. As spontaneous Raman spectroscopy is naturally an incoherent process, continuous-wave laser sources are commonly used because pulsed lasers require higher peak powers for sufficient signal-to-noise ratio, which can photobleach/damage samples.
The choice of wavelength of the laser source depends on the required application. Lower visible wavelengths and UV cause strong photoluminescence in organic materials, which can mask the Raman peaks. Therefore, a longer visible or near-IR wavelength (500—830 nm) laser source is often suited for studying organic materials, because of the reduced photoluminescence. However, the Raman signal intensity is inversely proportional to the wavelength of the pump light. Hence, longer wavelengths of light require longer acquisition times [1, 6].
Raman spectroscopy is most often performed using laser sources at λ =785 nm. This wavelength source is often selected as it balances the competing factors between Raman signal intensity, fluorescence, detector sensitivity and cost, and cost-effective/compact high-quality laser sources. However, visible lasers in the blue and green (e.g. λ =532 nm) are becoming more common in Raman spectroscopy [159].
Raman scattering is measured in terms of the wavelength shift from the source wavelength. Ideally the illumination source for Raman measurements should be purely monochromatic, in other words, a single wavelength. However, all laser sources possess a spectrum of wavelengths known as a linewidth. The linewidth of a laser is usually measured in Hertz and is typically> 1 MHz for solid-state lasers used in Raman applications. A narrow linewidth is preferable for Raman spectroscopy because the measured shift in the Raman scattering process is limited by the laser’s linewidth.
Laser sources for Raman spectroscopy need to be stable in wavelength and power over extended periods of time and from use to use. Raman spectra are usually collected over long integration times and for many acquisitions. If the wavelength of the source drifts during a measurement, then the Raman peaks will drift as well, because Raman is measured as a shift relative to the pump light. Wavelength drift is also problematic from measurement to measurement as it causes peaks to shift, in turn making comparisons between measurements difficult. The output power stability of the source is important for similar reasons. If the laser power drifts from measurement to measurement, then quantitative comparisons cannot be made easily.
Spectral purity is another key criterion for Raman laser sources. The spectral purity of laser sources often requires side-mode suppression better than 60 dB. In many cases, side-mode suppression is sufficient if> 60 dB spectral purity is reached at ~ 1–2 nm from the laser wavelength peak. However longer wavelength (near-IR) Raman spectroscopy requires side-mode suppression ratios within a few hundreds of pm from the main peak. These criteria are discussed in the context of common Raman laser sources in the following paragraphs [159].
Most modern Raman systems use solid-state laser sources rather than gas lasers because of their spectral quality and stability. There are three main categories of continuous-wave solid-state laser sources used in Raman spectroscopy:Diode-pumped single-longitudinal mode (SLM) lasers; single-mode diode lasers (distributed feedback (DFB) or distributed Bragg reflection (DBR)); and volume Bragg-grating (VBG) frequency-stabilised diode lasers. These laser sources have varying optical characteristics.
Diode-pumped SLM lasers are readily available in compact form from the UV to the near-IR. Power levels of several Watts are achievable at 1064 nm in the near-IR. In the visible range, numerous lines in the blue-green-red region (457 to 660 nm) are available with output powers of ~ 100 mW. In the UV spectral range, power outputs of 10–50 mW at 355 nm are available. Hermite-Gaussian laser beam modes are described by their transverse electro-magnetic mode (TEM):TEMm,n , where m and n represent the Hermite-Gaussian mode index [46]. Diode-pumped SLM lasers provide excellent TEM00 mode beams, precise wavelengths with low drift, and a single-frequency linewidth> 1 MHz. The spectral purity of diode-pumped SLM lasers is typically> 60 dB in terms of their side-mode suppression ratio. Weak emissions that neighbour the laser’s main peak several nanometres in spectral shift can occur in diode-pumped SLM lasers. However, these neighbouring lines can be mitigated with dielectric band-pass filters. The wavelength of diode-pumped SLM lasers is typically stable to within 4 pm over a temperature change of 30 °C.
Single-mode diode lasers are compact and cost-effective pump illumination sources with single-frequency linewidth (> 1 MHz), single-TEM beam quality and output powers of up to ~ 100 mW. Wavelengths of λ =785, 830, 980 and 1064 nm are most common in Raman spectroscopy. The side-mode suppression ratio is typically limited by sideband emission to ~ 50 dB at ~ 100 pm from the main peak.
VBG frequency-stabilised diode lasers use a narrow-linewidth VBG element with a diode-laser emitter to achieve narrow-line emission. These lasers are often used for applications requiring narrow-line emission at wavelengths that are not available for DFB or DBR laser sources. Frequency-locking multi-TEM diode lasers can be used to increase the output power of the narrow-linewidth emission. The stability of the output wavelength and linewidth requires careful thermomechanical control and high-precision alignment inside VBG frequency-stabilised diode lasers. Linewidths can range from single-frequency emission to ~ 10s of pm, depending on the wavelength and the output power. The side-mode suppression ratio is limited to ~ 50 dB, ~ 250 pm from the main peak emission. However, this can be improved using filters.
In confocal Raman imaging applications, it is necessary to use diffraction-limited TEM00 beams for optimum spatial resolution. However, this is relaxed for probe-based quantitative Raman analysis. In addition, confocal Raman setups require laser beam isolation as samples may generate optical feedback that is well aligned to the incident pump light. This counter-propagating feedback can induce power and noise instability and can even damage the laser source. Optical isolators are often integrated into the laser system itself because careful alignment must be achieved in the output after the isolator [4, 6, 159].
The spectrometer is a core component of any set-up used for measuring Raman spectra. The spectrometer should match the wavelength(s) of the laser source(s) used. The spectral range and resolution required will depend on the application. For example, the spectral range is determined by the position of the Raman peaks of interest (i.e. at large \( \Delta \overset{\sim }{\nu } \) ~ 3000 cm −1 or low \( \Delta \overset{\sim }{\nu } \) ~ 1 cm −1 ). If the application requires closely spaced Raman peaks to be resolved, then spectral resolution is key. The spectral resolution of a spectrometer is largely determined by the slit width at the spectrometer entrance, the focal length of the spectrometer, the dispersion, the size of the grating (or prism) and the size and sensitivity/quality of the detector. There is a trade-off between the overall spectral range and resolution when considering the design of the experiment for a given application. In the case of weak Raman signals, optimising the signal-to-noise ratio is a priority.
Spectral filtering plays a vital role in the acquisition of Raman spectra. Firstly, the incident laser light must be spectrally pure, which is accomplished with a narrow-linewidth laser source as discussed previously. However, if the laser light is delivered to the sample by an optical fibre, then it is inevitable that Raman generation will occur in the fibre. Therefore, it is important to use a narrow band-pass filter to reject any Raman signal generated in delivering the laser to the sample. Narrow band-pass filters can provide transmission> 90 % at the laser wavelength while suppressing light to an optical density of OD> 5 at wavelengths differing by just 1% from the laser wavelength.
Importantly, light collected for detection requires filtering to block the laser wavelength. If the laser light is not filtered out, it can go on to generate Raman in the detection arm of the set-up and drown out the desired Raman signal when it reaches the spectrometer. The type of filter required depends on whether Stokes, anti-Stokes or both are to be measured. To only detect anti-Stokes Raman, a short-pass filter should be used as anti-Stokes Raman light has a higher energy and hence shorter wavelength than the laser source. To only detect Stokes Raman, a long-pass filter should be used as the Stokes Raman light has a lower energy and hence longer wavelength than the laser source. Long pass edge filters with edge-transition widths of < 3 nm and edge steepness < 40 cm −1 are available. To detect both Stokes and anti-Stokes Raman light, a notch filter centred on the laser wavelength should be used as it allows both shorter and longer wavelengths to be detected. Notch filters with OD> 6 at the laser line wavelength are available. Multi-notch filters are also available and can block multiple laser lines simultaneously. Holographic notch filters significantly outperform dielectric notch filters, providing excellent attenuation of the Rayleigh line while passing light as near as 50 cm –1 from the Rayleigh line. Acousto-optic modulators can also be used in conjunction with an excitation laser to select emissions with a desired wavelength (as a filter) [160] or as a time-gated illumination system in tapping mode atomic force microscopy (AFM)-based TERS [161].
The quantum efficiency of standard room-temperature silicon-based CCD devices for Raman signal detection degenerates above λ =800 nm. For longer wavelengths, indium gallium arsenide array devices can be used, but these are less sensitive with higher noise levels and cost.
The visible to near-infrared wavelength range (λ =500–830 m) is particularly suitable for inorganic materials (e.g. graphene, carbon nanotubes (CNTs) and fullerenes) and SERS. UV lasers are attractive for organic materials (e.g. pathogens, proteins, DNA, and RNA). For materials with strong fluorescence that require near-IR illumination, it is common to use a 1064-nm wavelength.
Spontaneous and Coherent Raman Scattering Setups
Spontaneous Raman spectroscopy is most commonly used for modes with forbidden single-photon absorption or emission experiments [108]. SRS is sometimes used for wavelength shifting of coherent light, light amplification, pulse compression, phase conjugation and beam combining [108]. Unlike spontaneous Raman scattering, SRS is highly directional and offers enhanced signal strength and the ability to time-resolve the evolution and dephasing of coherent (ro-)vibrational motion [45].
Figure 3a shows a typical Raman setup based on a confocal geometry used by Wiedemeier et al. [162]. Confocal setups of this type are commonly used and employ an infinity-corrected objective lens (large numerical aperture (NA) lens) to focus the pump light. Wiedemeier et al. [162] used a diode-pumped solid-state laser as a monochromatic light source centred at 532 nm. Confocal mode is achieved by the use of a pinhole module in front of the spectrometer to spatially filter the light. The pinhole only passes light that originates from the focal plane to the detector. For detection of the Raman signal, a holographic-imaging spectrometer with an attached CCD camera is used. A holographic transmission grating with high light throughput served as a dispersive element, which enables large spectral ranges in a comparatively short time period to be acquired. Raster scanning of the sample in a confocal setup needs to be precise. Hence, a piezo actuated nano-positioner is used for positioning of the specimen.

a Typical confocal Raman spectroscopy setup. The pump laser is spatially filtered through a pinhole. The back-scattered Raman light is spatially filtered and spectrally filtered through a notch filter. The Raman light is analysed by a spectrometer and a charge-coupled device (CCD). Hyperspectral images are obtained by raster scanning the sample. b Typical CARS setup. Two laser sources provide the pump and Stokes light and are synchronised through a picosecond path difference mirror setup. In this setup, the incident light is focused through an optically transmissive sample substrate. Both the forward scattered light (F-CARS) and epi-scattered light (E-CARS) are spectrally filtered by band-pass filters and are subsequently detected by two avalanche photodiodes. CARS images are obtained by raster scanning the sample. c Typical SERS setup. The pump laser is coupled into a dark-field microscope in which the Raman light is edge-filtered and detected through a monochromator and EMCCD. The white-light source and dark-field mask provides the means for dark-field spectroscopy. The dark-field spectra of each plasmonically active nanoparticle are recorded through a secondary spectrometer (top right in c ). An imaging CCD camera is used to automatically find and centre each nanoparticle. d Typical TERS setup. The pump laser light is spatially filtered and passed through a half-wave plate. The evanescent mask ensures that only high numerical aperture (NA) pump light is incident on the sample such that total internal reflection occurs at the substrate-sample interface. This ensures that the tip apex is only illuminated by the evanescent light to achieve nanoconcentrated light in the vicinity of the tip. The reflected Raman light is filtered by an apertured mask (to remove any residual large NA pump light) and a notch filter. The Raman light is analysed by a spectrometer and a CCD. Hyperspectral images are obtained by raster scanning the sample. F, filter; M, mirror; RL, Raman light; CCD, charge-coupled device; PH, pinhole; BE, beam expander; D-BS, dichroic beam splitter; OBJ, Large numerical aperture (NA) lens; EMCCD, electron-multiplying charge-coupled device. a adapted from [162]. b adapted from [116]. c adapted from [85]. d adapted from [86]
Spontaneous anti-Stokes scattering is weaker than Stokes Raman scattering due to the relatively low probability of thermal excitation. Hence, anti-Stokes Raman spectroscopy is typically used with stimulated or coherent spectroscopy. CARS spectroscopy offers a 10 5 increase in conversion efficiency, spectral and spatial discrimination against fluorescence and, most importantly, does not require a monochromator. Due to the required coherence of the process, high-peak power pulsed tuneable laser sources are employed. These peaks are readily available using picosecond or femtosecond light lasers, the choice of which is determined by the spectral resolution required and the timescale of interest [139].
Avoiding direct electronic excitations in the sample is an important consideration as photochemical damage (due to photobleaching) can occur in samples. Djaker et al. [139], for example, use near-infrared laser sources to mitigate photobleaching in their samples of polystyrene beads.
Figure 3b shows a typical CARS setup that measures both forward scattered light (F-CARS) and back- or epi-scattered light (E-CARS) [116, 139, 163]. The system has two synchronised picosecond pulse trains. The pump and Stokes beams are generated by two picosecond Ti:Sapphire lasers operating at 80 MHz and are tuneable from 700 to 1000 nm to cover the entire spectrum of molecular (ro-)vibrations in biological systems (up to \( \Delta \overset{\sim }{\nu } \) ~ 3000 cm −1 ). The ps pulse duration is adjustable by a Gires-Tournois interferometer. The Ti:Sapphire lasers are pumped by a frequency-doubled CW Nd:Vanadate laser that provides monochromatic light at 532 nm. The two pulse trains were polarised with a pulse duration of 3 ps, corresponding to a spectral width of 1.76 cm −1 . The pump and Stokes beams are synchronously pulse picked through two Bragg cells to reduce the repetition rate of the pulse trains to several hundred kilohertz, thus avoiding photodamage of the sample while still maintaining high-peak power for CARS generation. The pump and Stokes beams are temporally synchronised by a SynchroLock system, which electronically adjusts the time delay between the two pulse trains. A small part of the output of the lasers are launched in optical fibres coupled to photodiodes and connected to a SynchroLock controller, which measures the lasers frequency or phase difference between the master and the slave; the timing jitter was reported to be ~ 250 fs. The spectral resolution was estimated to be 2.5 cm −1 , which is high enough to resolve Raman spectral features of biological samples. The use of a broadband Stokes wave enables the acquisition of a full CARS spectrum in only one measurement, with this configuration being known as multiplex or broadband CARS [164,165,166,167].
The two pulse trains are spatially filtered, collinearly combined and expanded through beam expanders. They are then sent into an inverted microscope and focused onto the sample by a water-immersion objective lens with a large NA. The E-CARS signal is collected by the same objective lens while the F-CARS signal is collected by a condenser lens with a lower NA. The E-CARS and F-CARS signals are filtered through a set of band-pass filters and detected by two avalanche photodiodes with a 200 μm × 200 μm active area. The CARS images are collected by raster scanning the sample, using an XYZ piezo flexure stage.
Several methods have been developed to suppress the nonresonant background associated with CARS. E-CARS is relatively insensitive to the nonresonant background of sample solvents [168]. Polarisation-sensitive CARS can differentiate the resonant and nonresonant signals by their polarisation [169]. However, these two techniques reduce the anti-Stokes signal strength [120]. Time-resolved CARS [170], temporal or spectral interferometry CARS [52, 171] and frequency-modulated CARS [172] can also suppress the nonresonant background. However, the setup in terms of both optics and electronics is challenging [120].
SERS Specific Considerations
A variety of nanostructures, such as bowtie antennas [173], nano-rings [174], nanovoids [175], nanoparticle aggregates [87, 176, 177], nanoflower [178], nanorod arrays [97] and nanowells [179] can be used for SERS. Each nanostructure can have a number of plasmonic resonances, and matching the excitation laser to these wavelengths can greatly enhance the SERS intensity [141, 180, 181]. Matching the plasmonic resonance to the pump laser can be done either by tuning the laser wavelength or by tuning the LSPR of the nanostructures [85, 182,183,184].
The difficulty faced in producing SERS substrates is consistency in fabrication and repeatability in measurements due to the inhomogeneity and randomness of SERS active hot spots [85, 185, 186]. For SERS substrates produced by top-down methods, such as electron beam lithography [187], the main challenge is scaling the fabrication. Conventional top-down methods limit the active area of the SERS substrate and are not conducive to large-area manufacturing. Bottom-up fabrication methods have their own set of problems. Even though bottom-up approaches allow wafer scale fabrication, consistency across the wafer is usually lacking [188]. This inconsistency hinders the repeatability of measurements, which is problematic for quantitative analysis. Colloidal SERS schemes suffer from complications introduced by stabilising agents at the surface of the nanoparticles, which help to keep nanoparticles in suspension. These stabilising agents can either impede or augment the measured Raman signal [189]. The chemical synthesis for nanoparticle colloids also requires precise optimisation. The poor reproducibility of nanoparticle colloidal synthesis hampers batch-to-batch consistency.
Often, only very few sites exhibit the highest SERS enhancement and the variability in size and shape can alter the plasmonic properties from the desired LSPR [85]. Figure 3c, shows a setup which combines SERS with dark-field spectroscopy. The dark-field spectrometer analyses the light scattered from the nanostructures (illuminated by the white-light source) to select nanostructures with the desired plasmonic properties.
TERS Specific Considerations
Scanning probe microscopy (SPM) techniques, such as atomic force microscopy (AFM), scanning tunnelling microscopy (STM) or shear force microscopy (SFM), are usually the tools of choice for TERS [86]. TERS has the ability to simultaneously measure topography by the conventional SPM mode of the system and obtain corresponding spectral information from a sample with nanometric spatial resolution and high sensitivity [86]. Certain SPM techniques ordain probe modifications for the plasmonically induced nanoscale evanescent light to activate/enhance the Raman signal. The tips can either be made of a metal or coated with a thin layer of metal to modify them for TERS. When the apex of a metallic or a metal-coated nanotip is illuminated with focused light at the LSPR wavelength, local surface plasmons around the tip apex are excited, and evanescent light is produced at the tip apex. This evanescent light can generate Raman scattering from a sample placed right under the tip apex. The process of Raman scattering takes place in the near-field and the spectral signal is scattered and converted back to the far-field by the tip apex, which is then collected by the usual optics and spectrometer in the far-field. Figure 3d shows such a TERS setup with a modified AFM. The setup consists of largely similar equipment shown in Fig. 3a (discussed in an earlier section). An inverted microscope illuminates the sample from underneath and the tip is placed at the top surface of the sample. The Raman back-scattered signal is then directed to the spectrometer. An evanescent mask blocks the central part of the laser beam inhibiting the low NA component of the incident light, so that only the high-NA component of the incident light reaches the sample so that total internal reflection occurs. This limits the transmitted light that falls onto the tip and, hence, only the evanescent light participates in the Raman scattering signal. Suppressing the participation of transmitted far-field light reduces the unfavourable background signal.
Polarisation-dependent TERS can be performed with light polarisation parallel to the tip apex in addition to the in-plane linear and radial polarisations. Polarisation dependent TERS is enabled by the large incidence angle from the high-NA objective lens and the use of devices that modify the polarisation state of the light such as a λ /2 waveplate [190]. The Raman scattered light is then collected in the low NA region through an apertured mask, which inhibits any residual laser light. As the tip apex approaches the sample within the focal spot, evanescent light is created at the tip’s apex [86]. Since the intensity distribution within laser focus is not uniform, it is very important to lock the relative position of laser focus to the tip [191, 192].
The strength and resolution of TERS depends on the ability of the tip to enhance and confine the light field at the tip’s apex, respectively. In STM systems, the tips are made of solid metal and the substrates need to be conductive in order to control the tunnelling current [193]. The STM tip resembles a long and smooth nanocone, with an apex diameter of ~ 20 nm. The length of the tip (~ tens of micrometres) makes them plasmonically unfavourable for visible light enhancement. However, the tunnelling gap between the tip and the sample can be tuned to the desired LSPR wavelength, creating a strong hotspot within the gap [143, 194, 195]. Some of the more advanced STM systems allow high-vacuum and low-temperature measurements [196]. As the substrate in STM needs to be conductive (often opaque in the visible wavelength range), the setup shown in Fig. 3d would not be suitable. Hence, a side illumination and side collection configuration is more common with STM-based TERS. To prevent the objective from mechanically interfering with the STM tip, a lens with a long working distance is required. It is therefore not trivial to tightly focus the incident light on the tip apex. A parabolic mirror can be used to mitigate mechanical interference and tightly focus the incident light to the tip apex as well as to collect the Raman signal [196, 197].
The spatial resolution in TERS is comparable to the size of the metallic nanostructure at the tip apex [86]. The gain in spatial resolution comes at a cost to overall signal enhancement (relative to SERS) due to the reduction of the Raman active volume.
In AFM systems, the tips are usually semiconductor cantilevers, with an apex diameter of ~ 5 nm. Figure 4 shows five examples of AFM-based TERS tips that have been demonstrated in the literature. The semiconductor tips are usually coated with metal either by thermal evaporation under high-vacuum [202] or electroless metal plating (mirror reaction ) [203] techniques. Figure 4a shows an example of a smooth AFM TERS tip. As the substrate does not need to be conductive, AFM-based TERS can be performed in either bottom-up transmissive illumination (as in Fig. 3d) or in side/top reflective illumination configurations; the transmissive configuration in Fig. 3d is more common.

a i Smooth metallic (silver; Ag) film-coated dielectric (silicon-dioxide; SiO2 ) atomic force microscope (AFM) tip. a ii SEM image of a Ag-coated AFM tip. After Ag coating by thermal evaporation, a thin granular Ag layer is deposited onto the tip. b i, Rough Ag-nanoparticle-coated SiO2 AFM tip. b ii SEM image of rough Ag-grain-coated SiO2 AFM tip formed during the thermal evaporation process. c i Single Ag nanoparticle attached to the apex of a SiO2 AFM tip. c ii SEM image of an AFM tip after photoreduction to selectively fabricate an Ag nanoparticle at the tip apex. d i Ag-coated SiO2 AFM tip with a focused ion beam (FIB) milled gap. d ii SEM image of antenna fabricated by FIB milling of annular ring and subsequent Ag thermal evaporation from under the tip. The mushroom shape shadows the annular ring from Ag coating. e i Illustration of side illumination TERS for surface plasmon polariton (SPP) nanofocusing. OBJ, objective. e ii Schematic of the tip structure for SPP nanofocusing which is composed of a SiO2 pyramidal structure (AFM tip) and a Ag film on the surface. The incident light is coupled to the surface by the FIB-fabricated grating nanostructure. e iii SEM image of a Ag-coated SiO2 tip with a FIB-fabricated grating structure. a i, b i and ii, c i reproduced from Ref. [198] with permission from The Royal Society of Chemistry. (ref.). a ii reprinted with permission from [86]. c ii Reprinted from [199] with permission from IOP. d i Adapted from [200]. d ii Reprinted from [200] with permission from IOP. e i Adapted from [201]. e ii and iii reproduced from Ref. [201] with permission from The Royal Society of Chemistry
The surface of AFM tips becomes nanostructured during the coating process resembling aggregated nanoparticles on the semiconducting tip (Fig. 4b) [198]. These nanostructures are suitable for the resonant excitation of LSPR and SPPs. The smooth tip shown in Fig. 4a has been fabricated by subsequently depositing a thin granular layer of additional metal. Other researchers have tested AFM tips with a metallic nanoparticle attached to the tip apex (Fig. 4c) [198], or a segregation in the tips coating to form an antenna (Fig. 4d) by focused ion beam lithography [115]. Tips can also be created by electrochemical deposition [204].
For transparent dielectric substrates, a thin metal film (thin enough to be transparent) can be coated onto the substrate to further enhance the field in the tip-sample gap [205]. It is also possible to perform TERS in liquids with AFM-based systems, which is favourable for biological specimens which require liquid environments to function [206]. Performing TERS in liquid with STM systems is much more difficult [86, 106]. SFM-based TERS is also an attractive technique and maintains many of the properties of AFM-based TERS with the exception of the tip material which resembles similar TERS properties of STM-based TERS [86, 156, 207, 208].
Some TERS setups have demonstrated vastly improved signal-to-noise ratio in TERS by SPP nanofocusing [201, 209, 210]. This technique focuses the laser onto a plasmon-coupling nanostructure (in the form of a grating) on the upper area of the tip, usually at a distance of ~ 10 μm from the tip apex. Figure 4e shows a typical nanofocused SPP-based TERS setup (i), the process of SPP nanofocusing by coupling the incident light to a focused ion beam-fabricated grating (ii), and an example SEM image of a SPP-nanofocusing tip (iii). The excited plasmons then propagate toward the tip apex through the process of adiabatic compression and create a confined EM field at the tip apex [209].
Tuning the Plasmon Resonance
The size, shape, composition of the nanostructures and inter-nanostructure spacing all affect the wavelength of the surface plasmon resonance [85, 86]. Metals are most often used as the conducting medium for surface plasmons; however, semiconductors also possess plasmonic characteristics [125]. Gold shows strong enhancement factors in the red spectral region [111, 177, 211, 212], silver in the blue-green spectral region [132, 213] and aluminium in the UV and deep UV spectral regions [150, 151, 175]. The blue-green spectral region is the most commonly used Raman spectroscopy range. However, silver is prone to oxidation which degrades the plasmonic characteristics within a few hours of exposure to atmosphere. For this reason, silver is often mixed with other metals, such as titanium [214].
The range of plasmon resonance can be tuned by the thickness and choice of coating metal, e.g. tungsten, gold, silver or aluminium. In TERS, the grain size of the metal coating corrugations (Fig. 4b) is roughly comparable to the wavelength of the LSPR/SSP. Unlike STM tips, it is possible to control the LSPR/SPP wavelength by adjusting the size of the nanoparticles. The surface plasmon resonance wavelength is also dependent on the refractive index of the dielectric material. In AFM-based TERS, for example, the silicon cantilever tip can be heated to ~ 1000 °C in the presence of water vapour to oxidise the silicon into silicon dioxide [215]. As SiO2 has a lower refractive index than Si, the surface plasmon resonance is blue shifted [86].
The size and shape of the metal-coated AFM tip apex can also be modified to tune the LSPR [199, 200]. Fabricating a single metallic nanoparticle attached to the tip’s apex (Fig. 4c) or segregated antenna-shaped tip (Fig. 4d) has been demonstrated as a means to finely tune the surface plasmon resonance in AFM-based TERS [199, 200, 208, 216]. However, the most commonly used tips for AFM-based TERS are the tips that have disconnected metal nanoparticles evaporated on a semiconductor cantilever in the standard coating process (Fig. 4b) described a priori [198].
Analysis Methods
A Note on Units
By convention, Raman spectra are considered in terms of the wavenumber \( \overset{\sim }{\nu } \) in units of cm −1 . The conversion from angular frequency is as follows:
$$ \overset{\sim }{\nu }=\frac{\omega }{2\pi {c}_0}, $$ (12)wo c 0 is the speed of light in vacuum and ω is the angular frequency. Raman spectra are usually plotted in terms of the wavenumber shift from the incident excitation radiation. This shift is defined as follows:
$$ \Delta \overset{\sim }{\nu }={\overset{\sim }{\nu}}_{\mathrm{p}}-{\overset{\sim }{\nu}}_{\mathrm{scat}}, $$ (13)where \( {\overset{\sim }{\nu}}_{\mathrm{p}} \) is the wavenumber of the pump beam with angular frequency ω p and \( {\overset{\sim }{\nu}}_{\mathrm{scat}} \) is the wavenumber of the scattered light accordingly. For Stokes Raman scattering, \( {\overset{\sim }{\nu}}_{scat}={\overset{\sim }{\nu}}_p-{\overset{\sim }{\nu}}_{osc} \) (where \( {\overset{\sim }{\nu}}_{osc} \) is the molecule or lattice vibration wavenumber) and \( \Delta \overset{\sim }{\nu } \) is positive. By contrast, for anti-Stokes Raman scattering, \( {\overset{\sim }{\nu}}_{scat}={\overset{\sim }{\nu}}_p+{\overset{\sim }{\nu}}_{osc} \) and \( \Delta \overset{\sim }{\nu } \) is negative [1].
Raman spectra are (by standard) presented with the wavenumber shift linearly increasing from right to left on the horizontal axis. The vertical axis ordinate is linear and proportional to intensity. However, researchers also present Raman spectra with wavenumber shift denoted simply as wavenumber and/or increasing from left to right instead of right to left [1].
Spontaneous Raman Spectra
Figure 5a shows the Rayleigh and the Raman spectrum of carbon tetrachloride (liquid) excited by an argon ion laser, \( {\overset{\sim }{\nu}}_1 \) ~ 20,487 cm −1 (487.99 nm). This spectrum is presented according to recommendations of the International Union of Pure and Applied Chemistry. It contains a strong band at \( {\overset{\sim }{\nu}}_1 \) ~ 20,487 cm −1 due to the Rayleigh scattering of the incident laser radiation and a number of weaker bands with wavenumbers, \( {\overset{\sim }{\nu}}_1\pm {\overset{\sim }{\nu}}_{osc} \):\( {\overset{\sim }{\nu}}_{osc} \) =218, 314, 459, 762 and 790 cm −1 . The Stokes Raman lines are shown on the left-hand side of the plot (Fig. 5a); the anti-Stokes Raman lines are shown on the right. The \( {\overset{\sim }{\nu}}_{osc} \) values relate to the fundamental vibrations of the carbon tetrachloride molecule [1]. In the original work by Raman and Krishnan [220], the same spectrum was measured using mercury arc radiation (\( {\overset{\sim }{\nu}}_1 \) =22,938 cm −1 , 435.83 nm). In this seminal work, the anti-Stokes bands at \( {\overset{\sim }{\nu}}_1+762 \) and \( {\overset{\sim }{\nu}}_1+790 \) cm −1 were not observed. Hence, after the invention of the laser, Rayleigh and Raman scattering experiments are preferably performed using monochromatically intense lasers.

a Spontaneous Stokes and anti-Stokes Raman spectrum of carbon tetrachloride (liquid) excited by an argon ion laser, \( {\overset{\sim }{\nu}}_{\mathrm{p}}=20487 \) cm −1 . The spectrum is presented according to recommendations of the International Union of Pure and Applied Chemistry. b i Raman spectra of thin multi-layer (nL) and bulk MoS2 films. The solid line for the 2 L spectrum is a double Voigt fit through data (circles for 2L, solid lines for the remainder). b ii Frequencies of \( {\mathrm{E}}_{2\mathrm{g}}^1 \) and A1g Raman modes (left vertical axis) and their difference (right vertical axis) as a function of the number of layers. b iii, iv spatial maps (23 μm × 10 μm) of Raman frequency of \( {\mathrm{E}}_{2\mathrm{g}}^1 \) (iii) and A1g (iv) from a sample of thin MoS2 films deposited on a SiO2 /Si-Substrat. b v Atomic displacements of the four Raman-active modes and one infrared-active mode (E1u ) in the unit cell of the bulk MoS2 crystal as viewed along the [1000] direction. c Microscopic image of nebulised ammonium sulphate aerosol particles on:i, Klarite; iii, silicon wafer. ii, iv Raman mapping image of sample (i) and (iii), respectively. d i Pseudo colour broadband CARS image of tumour and normal brain tissue, with nuclei highlighted in blue, lipid content in red and red blood cells in green. d ii Broadband CARS image and axial scan (below) with nuclei highlighted in blue and lipid content in red. d iii Broadband CARS image with nuclei highlighted in blue, lipid content in red and CH3 stretch–CH2 stretch in green. NB, normal brain; T, tumour cells; RBC, red blood cells; L, lipid bodies; WM, white matter. d iv Single-pixel spectra. e Raman thermography measurements across the active region of a high electron mobility transistor on SiC substrate with both E2 and A1 (LO) phonons considered to compensate for thermal stress. Device temperature rise determined using either E2 or A1 (LO) phonon mode alone (neglecting thermal stress) is shown in the top left insert. f (left) illustration of the manipulation of a straight isolated carbon nanotube (CNT) lying on a glass substrate by the sharp apex of an AFM tip. f (right) two-dimensional image of a CNT constructed by colour-coding the frequency position of the G+ vibrational mode in TERS spectra. The colour variation shows the strain distribution along the CNT at high-spatial resolution. a reproduced with permissions from [1]. b Adapted with permission from [217]. c Reprinted with permission from [96]. d Reprinted by permission from [167]. e Reprinted from [218]. f Reprinted by permission from [219].
Layered Two-Dimensional Systems
Raman spectroscopy can be used to determine the layer thickness in two-dimensional materials with atomic level precision, using either the inter-layer or intra-layer vibrational modes [19]. Leeet al. [12] demonstrated the technique with two intra-layer Raman modes of molybdenum disulphide (MoS2 ). Figure 5b shows representative Raman spectra for single- and few-layer MoS2 Proben. Among the four Raman-active modes of bulk 2H phase MoS2 crystal (shown in Fig. 5b v), Lee et al. [12] only observed the \( {E}_{2g}^1 \) and A 1g modes near \( \Delta \overset{\sim }{\nu } \) =400 cm −1 . The authors surmised that the other modes were not observed either because of the selection rules for the scattering geometry (E 1g ) [217] or because of the limited rejection of the Rayleigh scattering radiation (\( {E}_{2g}^2 \)) [13]. The authors [12] report that single-layer MoS2 exhibits a strong in-plane vibrational mode at \( \Delta \overset{\sim }{\nu } \) ~ 384 cm −1 , corresponding to the \( {E}_{2g}^1 \) mode of the bulk 2H-MoS2 Kristall. For all film thickness, the Raman spectra in Fig. 5b i show strong in-plane \( {E}_{2g}^1 \) and out-of-plane A 1g vibration signals. As the sample thickness increases (Fig. 5b i and ii), the \( {E}_{2g}^1 \) mode red shifts and the A 1g mode blue shifts. For films of four of more layers, the \( {E}_{2g}^1 \) and A 1g modes converge on the bulk values. Spatial maps of a MoS2 film sample for the \( {E}_{2g}^1 \) mode is shown in Fig. 5b iii; that of the A 1g mode is shown in Fig. 5b iv. These maps demonstrate that the frequency of the two modes only slightly vary in regions of the sample with a given layer thickness. Hence, Raman spectra can provide a convenient and reliable means of determining the layer thickness in two-dimensional crystalline materials with atomic level precision.
Enhanced Raman Scattering Through SERS
Ault et al. [221] were the first to use SERS to enhance the Raman scattering signal of previously undetectable secondary organic aerosol particles on Ag nanoparticle-coated quartz substrates. Fu et al. [96] demonstrated enhancement factors of 6 for the Raman spectra of ammonium sulphate (AS) at the Raman active mode \( {\overset{\sim }{\nu}}_{\mathrm{s}} \)(SO4 2− ) at 970 cm −1 with Klarite. Figure 5c shows a microscope image of a large AS particle on the surface of Klarite (Fig. 5c i), the corresponding Raman mapping image is in Fig. 5c ii. Figure 5c iii shows another sample of AS particle but on a silicon wafer. The corresponding Raman mapping image is shown in Fig. 5c iv. Aside from the three larger AS particles, small (sub-micron) AS particles are apparent in Fig. 5c iii. However, in the absence of SERS, these smaller particles are undetectable. On the other hand, the SERS Raman mapping image (Fig. 5c ii) shows a vastly enhanced signal intensity, as is evident from the scale bars, to the point where a number of small spots yield a signal at the \( {\overset{\sim }{\nu}}_{\mathrm{s}} \)(SO4 2− ) Raman mode. Such spots most likely correspond to small AS particles that are observable in Fig. 5c ii but are not apparent in Fig. 5c i.
Insights into Cellular Structure with CARS
CARS microscopy is relevant to the chemical [64, 222,223,224,225], materials [78, 226, 227], biological and medical fields [29, 36, 61, 63, 167, 228] and can provide unparalleled insights into cellular structures [53]. Spontaneous Raman and infrared micro/spectroscopy can provide adequate chemical specificity and sensitivity to delineate a variety of neoplasms [229,230,231,232,233,234,235,236,237] but require long integration times and have a coarse spatial resolution, which may limit accurate tumour-boundary identification and early-stage tumour detection. However, coherent Raman imaging techniques have demonstrated high-speed, high-spatial-resolution imaging, but with contrast limited to single or few Raman peaks [36, 53, 167, 232]. Figure 5d presents images of orthotopic xenograft brain tumours from within a murine brain [167]. Figure 5d i shows a broadband CARS image with nuclei in blue (\( \Delta \overset{\sim }{\nu } \) =730 cm −1 ), lipid content in red (\( \Delta \overset{\sim }{\nu } \) =2850 cm −1 ) and red blood cells in green (\( \Delta \overset{\sim }{\nu } \) =1548 cm −1 + 1565 cm −1 :C-C stretch from haemoglobin [238]). The large tumour mass and a projection of neoplastic cells within healthy tissue are clearly shown (Fig. 5d i). Figure 5 ii shows several small regions of main tumour mass migrating into the healthy brain matter. Figure 5 iii shows the boundary between normal brain tissue, white matter and tumour masses, which contrasts lipids in red (\( \Delta \overset{\sim }{\nu } \) =2850 cm −1 ); CH3 stretch-CH2 stretch (\( \Delta \overset{\sim }{\nu } \) =2944 − 2850 cm −1 ), a general contrast; and nuclei in blue (\( \Delta \overset{\sim }{\nu } \) =785 cm −1 ). The image shows the fibrous texture of the white matter and strands of myelination around cancer cell clusters. Figure 5d iv presents a set of single-pixel spectra from an intra-tumoural nucleus, the white matter and normal brain, respectively. The spectra indicate that lipids are most concentrated in the white matter and least in the tumour regions.
Raman Thermography
Advances in electronic and opto-electronic semiconductor devices, such as high electron mobility transistors (HEMTs), have led to thermal management challenges [65]. Conventional thermal characterisation approaches such as infrared thermography are often no longer applicable for the accurate characterisation of high-power density devices due to limited spatial resolution which can result in the underestimation of the device peak temperature [239]. Batten et al. [218] have demonstrated temperature profiling in AlGaN/GaN HEMTs using Raman thermography by exploiting the E2 and A1 (LO) phonon modes. Both the E2 and A1 (LO) modes shift to lower frequency when operating the device. Figure 5e shows a comparison of the temperature rise in a AlGaN/GaN HEMT on a SiC substrate from Raman thermography and thermal simulations. The device was operated at a source-drain voltage of 40 V and a power density of 25 W/mm and had a thermal resistance of 8 °C/(W/mm).
Measuring Strain on the Nanoscale Using TERS
TERS microscopy is an effective means of imaging nanostructures beyond the spatial resolution of the so-called light diffraction limit [152,153,154, 219]. Nanostructures such as DNA molecules [240], carbon nanotubes (CNTs) [241, 242], silicon devices [101, 243], dye molecules [244] and single molecules [83] can be imaged using TERS. The technique can even be used to measure the local molecular strain in nanostructured materials. For example, AFM can be used to manipulate CNTs with nanoscale precision to develop a local strain [245,246,247,3.0.CO;2-O " href="/articles/10.1186/s11671-019-3039-2#ref-CR248" id="ref-link-section-d64193610e7320">248]. Figure 5f (left) illustrates the process of CNT manipulation using contact-mode AFM. Although local strain in CNTs has previously been studied using AFM and transmission electron microscopy [245], TERS microscopy is the only optical technique that can provide images of such local structural distribution of nanomaterials. When a straight CNT is deformed by manipulation, a local breakdown in symmetry is induced. This causes the selections rules of Raman scattering to become relaxed, allowing forbidden Raman modes to become visible in the vicinity of the local curvature [219]. The position of the characteristic G-mode Raman scattering line in graphene can be used to deduce local strain using TERS [249]. Figure 5f (right) shows a TERS image of a deformed CNT which has been constructed from the peak positions of the G + -mode [219]. The image has a spatial resolution better than 20 nm which is about 25 times finer than the diffraction limit of the excitation wavelength of light (488 nm). The colour variation (as indicated by the scale bar) corresponds to the local peak position of the G + -mode and represents the variation of strain along the CNT.
Recent Results
Stimulated Raman Scattering Microscopy
Unlike CARS, SRS microscopy does not contain a nonresonant background signal that degrades image contrast. However, SRS can be affected by cross-phase modulation (where light at one wavelength modulates the refractive index in the medium affecting another wavelength of light), transient-absorption (which is characteristic of femtosecond light pulses) and photo-thermal effects which can modify the vibrational energy levels and reduce hyperspectral image contrast [250,251,252]. SRS is quantified by the amount of energy transfer from the pump light to the Stokes light when the difference frequency between the pump and Stokes light matches a specific vibrational frequency, ω osc . In addition, the resulting signal from SRS is strongly sensitive to the incident polarisations when the orientation of the probed vibrating species is ordered. This polarisation dependence can be exploited to probe the orientational order of vibrational modes in samples. However, currently developed techniques are not able to perform large-field fast time scale dynamics instantaneously due to the requirement of point-wise scanning over the sample space. Conventional polarisation-resolved techniques take minutes because each point of the scanning area must be polarisation tuned sequentially [74, 80, 253, 254].
Multi-lamellar myelin plays a crucial role for efficient transmission of nerve impulses as an electrical insulator [255]. The lipids and proteins in myelin self-assemble into a highly ordered and stable structure to form a tightly packed membrane [256]. In neurological disorders, this compact structure is highly perturbed leading to dysfunctions of the central nervous system [257, 258]. As these biological processes are highly dynamic, researchers seek to observe the dynamics of molecular order with sufficient resolution and frame rate. Hofer et al. [259] have recently demonstrated fast-polar-SRS by exploiting high-speed amplitude- and polarisation modulation with an acousto-optic modulator (AOM) and electro-optical polarisation modulation, respectively, to read out the molecular order and orientation at a fast rate. They therefore obtain both amplitude and phase information. The authors report the ability to retrieve density maps of molecular bonds with the absolute value of molecular order. The linear polarisation direction of the pump beam is rapidly rotated while the Stokes polarisation is circularly polarised to avoid polarisation dependence from the Stokes beam. The polarisation is further modified by a quarter-wave plate. The polarisation modulation leads to an α -dependant response of the signal intensity given by the following:
$$ I\left(\alpha \right)\propto {a}_0+{S}_2\cos 2\left(\alpha -{\varphi}_2\right) $$ (14)wobei α is the rotating pump polarisation direction in the sample plane, a 0 is the total measured intensity, and S 2 und φ 2 are the amplitude and phase of the second-order induced modulation [259].
Figure 6a.i shows a comparison of conventional polarisation SRS with that from Hofer’s fast-polarisation SRS on a multi-lamellar lipid vesicle (MLV). The fast-polarisation SRS image in the bottom of Fig. 6a i was obtained in 1 s which is two orders of magnitude faster than the conventional-SRS image (top) using the same incident powers, number of pixels and dwell time per pixel. Figure 6a ii shows sub-second frame-rate imaging of a MLV using double EOM-AOM modulation SRS at two instances in time. The measurement technique was remarked to have little effect on the lipid order properties during the measurement. Hofer et al.[259] were able to observe second-timescale dynamics in thin lipid membranes down to the cell plasma membrane using fast-polarisation-resolved SRS as shown in Fig. 6a iii.

a Comparison of conventional and fast-polarisation SRS on multi-lamellar lipid vesicles (MLVs). a i–iii the composite images show absolute local molecular order (S2 ) and mean molecular orientation (φ 2 ) values represented as coloured sticks. a i (top) Conventional polarisation SRS on a MLV using step angles of 5° (acquisition time 112 s); the total measured intensity (a 0 ) is represented as a grey-scaled background. a i (bottom), fast-polarisation SRS on the same MLV (acquisition time 1 s); the acousto-optic modulation (AOM) is shown as a grey-scaled background. a ii Fast-polarisation dynamics SRS images of lipid order in a MLV taken at different times of the observation sequence shown; the AOM is shown as a grey-scaled background. Zoomed regions at the upper part of the MLV contour show no change in lipid order during the measurement over tens of seconds. a iii Fast-polarisation dynamics of lipid order in a thin lipid membrane. Coloured sticks show S 2 und φ 2 and the grey-scale background shows the AOM amplitude. b i SRS flow cytometry (SRS-FC) setup. b ii Colour-coded constrained principle component analysis (CPCA) scatter plot of SRS-FC spectra from mixed PMMA (red), PS (blue) and PCL (green) beads. The principle components (PC 1 and PC 2) are distinguished subpopulations of mixed polymer beads according to the distinct Raman spectra. Data were acquired in 6 s using a bead mixture with a concentration of 2% solids. The beads were 10 μm in diameter. b iii (left) Colour-coded CPCA scatter plot from SRS-FC analysis of lipid amount in 3T3-L1 cells with principle components differentiated through quantification of distinct chemical compositions inside single cells. Data were acquired in 3 s. b iii (right) SRS images of the two 3T3-L1 cell types. c i Illustration of the generation and amplification of a new orbital angular momentum (OAM) laser in a configuration with no initial OAM using a Hermite-Gaussian (TEM) laser. c ii, iii Simulation of the generation and amplification of a new OAM mode from initial configurations with no net OAM. c ii The initial seed TEM modes in x - und y -directions (top and bottom, respectively). c iii The new OAM mode electric field components at z =3.5 mm in x - und y -directions (top and bottom, respectively). The new mode is linearly polarised in the x - und y -directions with l 1x = l 1y = − 1 from an initial seed polarised in the x -direction with a TEM01 mode and in the y -direction with a TEM10 mode that is π /2 out of phase with respect to the TEM01 mode polarised in x . The pump is a Gaussian laser polarised at 45°. Projections in the (x,y) plane (blue-white-red) show the normalised vector potential (ϕ0) field envelope of the new OAM mode at the longitudinal slice where the laser intensity is maximum. The envelope of the 3D laser intensity is also shown in blue-green-red colours and normalised vector potential isosurfaces in blue and red. The values of the laser vector potential illustrated by the isosurfaces are shown in c (ii) and c (iii). a reproduced with permission from the OSA [259]. b reproduced with permission from the OSA [260]. c Adapted from [46] and licenced under CC BY 4.0.
Flow cytometry (FC) is one of the most important technologies for high-throughput single-cell analysis. FC is a technique used to measure physical/chemical characteristics of a population of cells or particles suspended in a fluid [59, 261]. The fluid suspension flows through the instrument detectors for fluorescent labelling which is the primary approach for cellular analysis in FC. Figure 6b i shows an optical FC setup [260]. However, for small molecules, the fluorescent tags can perturb the biological function of the species. In addition, non-specific binding of fluorescent labels as well as cellular autofluorescence can also reduce the clarity of the result. SRS flow cytometry (SRS-FC) non-invasively detects chemical cell content but conventional techniques suffer slow acquisition rates.
Zhanget al. [260] have recently demonstrated label-free high-throughput single-particle SRS-FC with a 32-channel multiplexing technique. Their technique measured single-particle chemistry at a rate of 5 μs per SRS spectrum, approaching that of standard fluorescence-based FC. The SRS-FC technique was based on broadband laser excitation and a multiplex spectral detection system. The systems allowed the acquisition of 200,000 spectra per second, more than 11,000 particles per second. The subpopulations of species, such as mixed polymer beads and 3T3-L1 cells, could be separated and distinguished through compositional principle component analysis (CPCA) of the SRS signals. The principle components were designated according to their Raman spectra. An agglomerative clustering procedure was performed on the resulting CPCA spectral matrix. This procedure assumed the number of cluster groups (κ ) was known to separate the clusters of principle components in the CPCA analysis. Figure 6b ii shows the CPCA of the SRS spectra for a mixture of three types of beads:poly-methyl-methacrylate (PMMA), polystyrene (PS) and polycaprolactone (PCL), all with a 10-μm mean diameter, mixed at a 2:1:1 ratio of PMMA:PS:PCL and a final concentration of 2% solids in the fluid. The flow speed was ≈ 0.16 ms −1 , the SRS-FC data was acquired in 6 s. The CPCA plot (Fig. 6b ii) shows three distinct clusters of principle components. The agglomerative clustering procedure (κ =3) allowed the quantification of ~ 7100 PMMA bead (red), ~ 3400 PS beads (blue) and ~ 3600 PCL beads (green) as shown in Fig. 6b ii. Their measurement demonstrated the ratio of ≈ 2:1:1 (PMMA:PS:PCL) at a throughput rate of ~ 2350 particles per second and that their multiplex SRS-FC system, paired with the CPCA analysis, could distinguish different chemical components with small spectral differences. Zhanget al. [260] were able to detect beads as small as 1 μm and were even able to detect single Staphylococcus aureus bacteria flowing through the laser focus highlighting the potential to characterise subcellular organelles with SRS-FC.
Zhanget al. [260] also demonstrated the discrimination of 3T3-L1 cells at different stages of cell differentiation according to their difference in lipid amount using SRS-FC. After insulin-induced differentiation, 3T3-L1 cells acquire an adipocyte-like phenotype with a significantly increased amount of triglycerides which aggregate to form large lipid droplets. This aggregation of triglycerides causes the intensity of the methylene symmetric vibration at \( \Delta \overset{\sim }{\nu } \) =2850 cm −1 from fatty-acid acyl chains to become stronger compared to that of non-differentiated cells which provides the means for CPCA analysis. Figure 6b iii shows the CPCA scatter plot of the cell mixture measured by Zhang et al. [260] which were separated using the agglomerative clustering approach. The insert SRS images (Fig. 6b iii, right) show a non-differentiated 3T3-L1 cell and a differentiated cell with the formation of large lipid droplets.
Twisted Laguerre-Gaussian lasers, with orbital angular momentum (OAM) and characterised by doughnut-shaped intensity profiles, are of great interest to a number of growing research fields such as ultra-cold atoms [262,263,264], microscopy and imaging [265, 266], atomic and nanoparticle manipulation [267, 268], ultra-fast optical communication [269, 270], quantum computing [271], astrophysics [272] and plasma accelerators [47]. Spiral phase plates or computer-generated holograms are usually used to generate visible light with OAM [273,274,275,276]. Spiral phase plates can produce light with predefined OAM modes. By using plasma as an optical medium to generate and amplify laser pulses with OAM and relativistic intensities, well above the damage threshold of optical devices, could provide for high-energy-density science and applications. Plasmas also allow for greater flexibility in the level of OAM in the output laser beam than conventional optics. Vieira et al. [46] have shown that SRS in nonlinear optical media with Kerr nonlinearity (e.g. plasmas, optical fibres and nonlinear optical crystals) can be used to generate and amplify OAM light. The authors show that it is possible to generate and amplify light with OAM when no net OAM is initially present. Figure 6a i illustrates the process in which the pump EM fields can have different OAM components in both transverse directions x und y (blue and orange in Fig. 6a i). l 0x is the pump electric field component of OAM in the x Richtung. Likewise, l 0y is the pump electric field component of OAM in the y Richtung. The initial seed electric field component has an OAM component l 1x . After interacting with the plasma, the pump is depleted, and a new electric field component appears in the seed with OAM l 1y = l 1x + l 0x − l 0y .
The authors [46] use an analytical theory for arbitrary transverse laser field envelope profiles and particle-in-cell simulations for plasma. Stimulated Raman backscattering in plasma is a three-wave mode coupling process in which a pump pulse decays into an electrostatic (Langmuir) plasma wave as well as a counter-propagating seed laser. The plasma can be viewed as a high-intensity mode converter. The presence of OAM in the pump and/or seed results in additional matching conditions that ensure the conservation of angular momentum of the pump when the pump decays into a scattered electro-magnetic wave and a Langmuir wave [40].
Particular superpositions of Hermite-Gaussian modes TEM modes are mathematically equivalent to Laguerre-Gaussian modes [277]. Vieira et al. [46] therefore explore the use of Stimulated Raman backscattering to generate and amplify light with OAM using TEM laser beams with no initial net OAM. Each Hermite-Gaussian beam in the simulation is described by TEMm ,n , where m und n represent the Hermite-Gaussian mode index. Figure 6c ii and iii show the 3D simulation results from the setup shown in Fig. 6c i. The simulations show that SRS results in a new OAM mode with l 1 = 1 linearly polarised at 45°. The field topology of the seed normalised vector potential changes from plane isosurfaces in Fig. 6c ii, to helical isosurfaces in (Fig. 6c iii). Hence, light with OAM has been generated from light with no net OAM. The authors [46] note that their results could be extended to other nonlinear optical media with Kerr nonlinearity. In the case of plasma, the interaction between the seed light and the pump light occurs via an electron Langmuir wave. This interaction ensures that the frequency, wavenumber and OAM matching conditions are conserved.
Coherent Anti-Stokes Raman Scattering Microscopy
CARS results from an induced anti-Stokes scattering of radiation, ω AS , which is enhanced when ω p − ω S = ω OSC . One of the main challenges with CARS microscopy is the nonresonant background. The existence of the nonresonant background can either distort or even saturate the resonant signal of Raman peaks, which reduces the image contrast. Qin et al. [278] have recently demonstrated multi-colour background-free coherent anti-Stokes Raman scattering microscopy using an all-fibre, low-cost, multi-wavelength time lens Quelle. A time lens, in analogy to a spatial lens, is simply a quadratic optical phase modulator in time, which can be approximated by a portion of a sinusoidal phase modulator [279,280,281]. Three different wavelength picosecond pulse trains were provided by the time lens source, at 1064.3 nm (stable), 1052–1055 nm (tuneable) and 1040–1050 nm (tuneable). The time lens was used to apply temporal quadratic phase modulation to a continuous-wave laser to broaden its spectral bandwidth [279, 282,283,284,285,286,287,288]. In this instance, the time lens was applied with fibre-integrated electro-optic radio-frequency phase modulators. The phase modulation and pulse synchronisation were derived from a mode-locked Ti:Sapphire laser that provided synchronised multi-colour picosecond pulses with dispersion compensation. Electronic tuning of the pulse delay was used to achieve temporal overlap between the pump and Stokes laser pulse trains, which is a convenient substitution for mechanical optical delay paths. Two of the three wavelengths of light from the time lens source were used for two-colour on-resonance imaging and the third wavelength for off-resonance (nonresonant background subtraction) imaging. Pixel-to-pixel wavelength switching was achieved, which provided simultaneous two-colour CARS imaging with real-time nonresonant background subtraction. Qin et al. [278] demonstrated the technique with an excised fresh tissue sample from a mouse ear and imaged molecular stretching vibrations at 2845 cm −1 (CH2 ) and 2940 cm −1 (CH3 ) and non-resonance background at \( \Delta \overset{\sim }{\nu } \) =2770 cm −1 . Figure 7a i–iii shows the process applied to the Raman peak of CH3 stretching vibration from the mouse ear tissue sample.

a Simultaneous two-colour CARS imaging with real-time nonresonant background subtraction from a mouse tissue sample at a surface depth of 45 μm. a i CARS image acquired at 2940 cm −1 (CH3 stretching vibration). a ii Off-resonance background CARS image at 2770 cm −1 . a iii Background-free image of (i) at 2940 cm-1 after subtraction of the nonresonant background (ii). b Multi-lamellar lipid vesicle (MLV) imaged with conventional (i) and symmetry-resolved CARS (SR-CARS) at 1133 cm-1 (ii) and (iii). ii The incident circularly polarised pump, Stokes, probe and anti-Stokes light have co-rotating handedness (m F = 0). iii the incident circularly polarised pump, probe and anti-Stokes light have co-rotating handedness and the Stokes light has counter rotating handedness (m F = 2). c High-speed polarisation-resolved CARS image sequence on a MLV moving over the sample surface taken at different times of the observation sequence shown as a composite image of S 2 und φ 2 as coloured sticks and with the acousto-optic modulation (AOM) as a grey background. a reproduced with permission from the OSA [278]. b Adapted from [289] and licenced under CC BY 4.0. c reproduced with permission from the OSA [259].
The nonresonant background signal in CARS can also be suppressed by applying an external static electric field to the sample known as electro-CARS. Capitaine et al. [120] demonstrate this electro-optical technique on n-alkanes in solution with broadband multiplex coherent anti-Stokes Raman scattering spectroscopy. The nonresonant background is suppressed due to the orientation response of the molecules to the electric field. The molecular orientation is related to the induced electric dipole moment. The enhancement of the CARS signal-to-noise ratio was achieved in the case of the CH2 und CH3 symmetric/asymmetric stretching vibrational modes.
Conventional CARS provides information about the chemical nature but not about the molecular organisation or symmetry in the system. The Cartesian components of the nonlinear susceptibility tensor χ (3) represent the vibrational symmetry properties of the material [290, 291]. These tensor elements can be extracted with polarisation-resolved coherent Raman scattering schemes [72, 74, 169, 259, 292,293,294,295]. However, these schemes often involve the acquisition of multiple images from different polarisation angles requiring long acquisition times due to limits imposed by polarisation tuning [259] and time-consuming post-processing [67].
Cleff et al. [289] have recently demonstrated a label-free microscopy technique that uses circularly polarised light to probe the symmetry as well as the chemical fingerprint of the probed sample in a single acquisition. This symmetry-resolved CARS (SR-CARS) depends on both the presence of (ro-)vibrational modes as well as their local organisation. By switching between combinations of left- and right-handed circular polarisation states for the involved fields, the individual symmetry contributions of the sample can be imaged. This technique offers a straightforward means to access the local organisation of (ro-)vibrational bonds with improved image contrasts (with 1 to 2 orders of magnitude) for anisotropic samples, as well as improved chemical selectivity without post-processing and independently of sample orientation in the transverse plane. In addition, SR-CARS provides higher chemical selectivity with the contrast in symmetry characteristics, which are not accessible with conventional spontaneous Raman or SRS microscopy.
Multi-lamellar lipid vesicles (MLVs) are made of a tight packing of lipid layers forming a ring of highly ordered matter with twofold symmetry and a lipid orientation distribution close to a Gaussian angular shape [74].
Figure 7b i shows a conventional CARS image of an aqueous MLV at \( \Delta \overset{\sim }{\nu } \) =1133 cm −1 (C-C stretching vibration) which illustrates the expected poor contrast due to the nonresonant background [289]. Figure 7b ii and iii show the zeroth and second-order \( {m}_{\overline{F}} \)-value image of the same MLV as in Fig. 7b ii. The \( {m}_{\overline{F}} \)-value is the summation of the light circular polarisation handedness quantum numbers of the incident light beams:
$$ {m}_{\overline{F}}={m}_{\mathrm{p}}-{m}_{\mathrm{s}}+{m}_{\mathrm{p}\mathrm{r}}-{m}_{\mathrm{as}} $$ (15)When light with field tensor \( \overline{F} \) probes matter with nonlinear susceptibility tensor χ (3) , in a CARS process, the light probes only the parts of the matter with identical rotational invariant symmetries (i.e. identical \( {m}_{\overline{F}} \)). Hence, by engineering the field tensor of the light, specific sample symmetries can be directly read out, creating a symmetry-based image contrast mechanism [289]. The aqueous solution surrounding the MLV is only visible in the \( {m}_{\overline{F}}=0 \) image (Fig. 7b ii) due to its purely isotropic nature. Background-free imaging of the MLV with superior contrast with respect to conventional CARS is shown in Fig. 7b iii at \( {m}_{\overline{F}}=2 \), which results from the symmetric microscopic organisation of the lipids in the MLV. Imaging at \( {m}_{\overline{F}}=4 \) (not shown) lacked sufficient signal strength to provide an image of the MLV due to the lack of anti-symmetry in the lipid organisation.
As with SRS, the CARS signal is sensitive to the polarisation of the incident light when the orientation of the scattering species is ordered. Polarisation-resolved CARS (PR-CARS) requires monitoring of the CARS signal response depending on the relative rotation of the incident light polarisations (pump and Stokes) to the sample, in species with ordered orientations. Provided that the molecular bonds are oriented, the detected intensity of the anti-Stokes signal is maximised when the incident polarisations lie along the averaged direction of the bonds. The ability to monitor lipid order without the need for fluorescent labels can provide information on lipid packing properties. As mentioned, PR-CARS schemes often involve long acquisition times due to limits imposed by polarisation tuning and time-consuming post-processing.
In addition to fast-polar-SRS, Hofer et al. [259] have recently demonstrated fast-polar-CARS imaging with combined electro-optic polarisation and acousto-optic amplitude modulations. Figure 7c shows fast-polarisation CARS with similar sensitivity to that of SRS (shown in Fig. 6a). Despite the requirement of lock-in amplification for the detection of low modulation over a large nonresonant background, the fast-polarisation technique demonstrated by Hofer et al. [259] can considerably improve the signal-to-noise ratio in CARS imaging. Despite the robustness of MLVs, occasional alteration of molecular order in MLVs could be observed at the time scale accessible in Hofer’s experiment (0.25–1 s per image). MLVs could detach from the sample surface, inducing motion (Fig. 7c) or shape change. The modifications observed in Fig. 7c were attributed to a local membrane disruption, followed by its spontaneous reformation. Hofer et al. [259] demonstrated the possibility of visualising local modification during MLV displacement that was not accessible using the minute-time-scale conventional polarisation Raman experiments.
There have also been a number of developments in CARS flow cytometry (CARS-FC) [58, 296, 297]. However, these techniques were shown to be much slower than fluorescence-based FC. Out-of-focus microparticles can randomly impede CARS-FC and the fluid often generates a strong nonresonant background limiting CARS-FC from achieving high-throughput single-cell analysis. Recently, however, O’Dwyer et al. have demonstrated that it is possible to significantly enhance the fraction of unambiguously and instantly recognised in-focus microparticles, in unconstrained flows by co-monitoring CARS-FC with linear scattering of light.
CARS is invariably performed with two synchronised picosecond laser sources owing to the coherence life time of Raman resonance. Ti:Sapphire oscillators [168] or optical parametric oscillators pumped by a picosecond frequency-doubled Nd:Vanadate laser [53] are the instruments of choice, which are generally very expensive and the synchronisation mechanisms can be challenging. In addition, the spectral drift in the pump wavelength can introduce errors in the calculation of ω osc . Langbein et al. [124] have demonstrated CARS micro-spectroscopy using a single Ti:Sapphire laser oscillator and simple passive optical elements. Vibrational excitation, tuneable over a large spectral range with adjustable spectral resolution, was achieved by spectral selection with dichroic mirrors and linear chirping by glass elements.
Tip-Enhanced Dual Wavelength Coherent Anti-Stokes Raman Scattering Microscopy
TERS offers spatial resolution far beyond the diffraction limit of the probing light. The more conventional technique is to directly illuminate the tip-sample cavity [86]. This technique achieves the desired resolution (beyond the diffraction limit) by forcing the evanescent light into the far field image formation. However, the far field light presence in the tip-sample cavity generates an unfavourable background light source. It is possible to perform TERS by coupling the far-field excitation light to the tip a few tens of micrometres from the tip apex [298]. Femtosecond laser pulses can be coupled to the tip surface by shining the light on a grating fabricated on the tip surface. The SPPs then propagate to the tip apex and generate background-free localised optical excitation [210].
Toma et al. [298] previously demonstrated selective excitation of a single Raman mode and its CARS imaging of CNT using ultra-fast SPP pulse nanofocusing using an Au tapered tip. In a more recent publication, seminal work by Tomita et al. [155] demonstrated simultaneous nanofocusing of ultra-fast SPP pulses at 440 and 800 nm, which were coupled with a common diffraction grating structure. Figure 8a i, illustrates the scheme. The Al-tapered tip had an apex radius of ≈ 35 nm. Selective CARS microscopy that combined an 800 nm (ω ) SPP pump pulse and a 440-nm (2ω ) SPP probe pulse was achieved. Figure 8a ii illustrates the energy level process of ω - and 2ω -CARS. The pump pulse achieves selective vibrational excitation by spectral focusing [299,300,301,302]. Raman shift intensities with this 2ω-CARS scheme were reported to increase by as much as 4 compared with that of ω-CARS for monolayer graphene. The selectivity of vibration band excitation and background noise suppression were confirmed on the CARS intensity probed by a 2ω -SPP plasmon pulse for a monolayer graphene sample. Venezuela et al. [8] reported the Raman lines in graphene associated with both phonon-defect processes (such as the D line at \( \Delta \overset{\sim }{\nu } \) ~ 1350 cm −1 ) and two-photon processes (such as the 2D line). The 2D-band intensity in graphene was reduced monotonously when the defect concentration was increased, contrary to the D-band. Tomita et al. [155] applied their multi-vibrational-mode 2ω-CARS imaging method to a multi-walled CNT (MWCNT) at the D, G and 2D bands. This dual-wavelength nanofocusing technique could open new nanoscale micro-spectroscopy and optical excitation schemes in SPM, such as sum frequency mixing, two-photon excitation (ω +2ω ) and pump-probe schemes.

a i Illustration of tip-enhanced dual-wavelength nanofocused CARS on a multi-walled carbon nanotube (MWCNT). a ii Energy diagram for ω-CARS and 2ω-CARS. When the difference frequency between pump and Stokes light matches the vibrational mode of the molecule, it is resonantly excited. When ω and 2ω-probe light is simultaneously incident within the dephasing time, ω- and 2ω-CARS photons are respectively generated. b i Simultaneous topographical 2ω-CARS imaging of a MWCNT. b ii Composite image of three 2ω-CARS images of the MWCNT using the 2ω-CARS spectrum from D- (red), G- (blue) and 2D- (green) bands. Reprinted with permission from [155]
Figure 8b i shows a topography image of a MWCNT with a diameter of ~ 175 nm measured by the Al-tapered tip. Figure 8b ii shows a composite image of three 2ω-CARS images of the MWCNT using the 2ω-CARS spectrum from D- (red), G- (blue), and 2D- (green) bands. In Ref.-Nr. [155], the D- and 2D-band showed a negative correlation (in agreement with ref. [8]) except for the central part of the MWCNT. The 2D- and G-bands were intense near the central part of the MWCNT. Tomita et al. [155] indirectly estimated the spatial resolution of their technique to be less than 90 nm by taking the profile of the 2D-band signal across the axis of the MWCNT.
Conclusions
This review detailed the numerous applications of Raman spectroscopy and its advanced derivatives:stimulated Raman scattering, coherent anti-Stokes Raman scattering and surface- and tip-enhanced Raman spectroscopy. A description of the fundamental physics that underpins these techniques has been provided. Experimental considerations have been discussed with examples of typical instrumentation used. Examples of the analysis techniques employed to interpret the Raman spectroscopic data were presented and discussed.
The Raman effect now underpins prominent spectroscopic techniques in biology, medicine, crystallography and flow cytometry and has gained interest in plasma physics. It is employed as a non-invasive label-free chemically selective hyperspectral imaging technique with recent advances enabling the probing of molecular orientation and chemical composition. SRS and CARS are used to enrich signal detection at specified wavelengths associated with vibrational modes that are prescribed for spectral-selective imaging. Unlike SRS, CARS carries with it a nonresonant background contribution to the spectrum. This review detailed some of the efforts to suppress this unfavourable contribution.
Surface-enhanced Raman scattering is an ultrasensitive Raman technique that has enabled the detection of trace amounts of molecular species in samples that would otherwise be undetectable in spontaneous- or coherent Raman scattering techniques. The enhancement effect is largely associated with the plasmonic activity of the sample surface, which augments the light-matter interaction. This enhancement effect is optimised by tuning the plasmons associated wavelength with plasmonically active surface nanostructures.
Tip-enhanced Raman scattering spectroscopy is a relatively new technique that can capture hyperspectral images with spatial resolution beyond the diffraction limit of light. As light is fundamental to the Raman effect, the spatial resolution offered by TERS is so far unparalleled by other Raman scattering techniques. The surface plasmon wavelength can also be tuned for TERS techniques and recent advances have exploited surface plasmon polaritons to focus evanescent light at the tip apex with light coupled remotely from the tip apex. This technique has yielded enhanced the signal-to-noise ratio by removing the far-field light from the apex region. Recent advances have demonstrated this technique with dual-wavelength CARS.
Verfügbarkeit von Daten und Materialien
Not applicable
Abkürzungen
- AFM:
-
Rasterkraftmikroskopie
- AOM:
-
Acousto-optic modulator
- AS:
-
Ammonium sulphate
- CARS:
-
Coherent anti-Stokes Raman scattering
- CARS-FC:
-
CARS flow cytometry
- CNT:
-
Kohlenstoff-Nanoröhrchen
- CPCA:
-
Compositional principle component analysis
- CRS:
-
Coherent Raman scattering
- DBR:
-
Distributed Bragg reflection
- DFB:
-
Verteiltes Feedback
- E-CARS:
-
Epi-scattered CARS
- EM:
-
Electro-magnetic
- FC:
-
Flow cytometry
- F-CARS:
-
Forward scattered CARS
- HEMTs:
-
High electron mobility transistors
- LSPR:
-
Local surface plasmon resonance
- MLV:
-
Multi-lamellar lipid vesicle
- MoS2 :
-
Molybdenum disulphide
- MWCNT:
-
Mehrwandige Kohlenstoff-Nanoröhrchen
- NA:
-
Numerical aperture
- OAM:
-
Orbital angular momentum
- PCL:
-
Polycaprolactone
- PMMA:
-
Poly-methyl-methacrylate
- PR-CARS:
-
Polarisation-resolved CARS
- PS:
-
Polystyrol
- SERS:
-
Oberflächenverstärkte Raman-Streuung
- SFM:
-
Shear force microscopy
- SLM:
-
Single-longitudinal mode
- SPM:
-
Scanning probe microscopy
- SPP:
-
Oberflächenplasmonenpolariton
- SR-CARS:
-
Symmetry-resolved CARS
- SRS:
-
Stimulated Raman scattering
- STM:
-
Rastertunnelmikroskopie
- TEM:
-
Transverse electro-magnetic mode
- TERS:
-
Tip-enhanced Raman scattering
- VBG:
-
Volume Bragg-grating
Nanomaterialien
- TPM-Tools:Techniken und Software für den Erfolg
- Techniken für die additive Fertigung und das Prototyping
- Die Grundlagen und Vorteile der zustandsorientierten Instandhaltung
- Was ist Sprühschweißen? - Verfahren und Techniken
- Wie man Titan schweißt:Verfahren und Techniken
- Mikrobearbeitung:Techniken, Möglichkeiten und Herausforderungen
- Bearbeitungsprozesse und -techniken
- Die Grundlagen der Verzinkung und die damit verbundenen Vorteile
- Die Grundlagen des Anfasens und Entgratens von Verzahnungen
- Verständnis des Lichtbogen-Bolzenschweißens und seiner Techniken